Quantifying MTTR Cost in Backend Engineering Teams
Four hidden costs hide in incident response beyond recovery time itself.

MTTR looks like a single number on a dashboard: minutes from alert to resolution, tracked, graphed, reported up the chain. That framing undercounts the real cost by a wide margin. The full cost of an incident is built from four layers, revenue loss, coordination overhead, engineer time, and a retention drag that never appears in any postmortem, and teams that only chase the number on the dashboard are leaving most of the actual bill unpaid. Worse, most of them are optimizing the wrong phase.
Start with definitions, because the industry is sloppy about this. MTTR here means Mean Time to Recovery: the clock starts when a system detects a problem and stops when service is restored to users, full stop. That differs from Mean Time to Resolution, which requires eliminating the root cause, not just getting users back online. DORA renamed its own version of this metric to "Failed Deployment Recovery Time" in its 2023/2024 guidance, scoping it strictly to impairments caused by software changes. The industry still calls it MTTR out of habit, and this piece will too.
The deeper issue with the single-number framing is that it collapses five distinct phases, detect, acknowledge, assemble, diagnose, resolve, into one blob. Each phase has its own cost driver: detection failures cost revenue, assembly failures cost coordination labor, diagnosis failures cost specialist time, resolution failures cost whatever it costs to actually fix the thing. Most teams pour their optimization budget into the resolve phase, because it's the part engineers can point to and say they made it faster. That's the wrong place to spend first. The other four phases quietly eat the rest of the budget, unmeasured and unmanaged, and detection is the phase this piece returns to at the end.
The revenue floor: what every minute of downtime costs
The Splunk/Cisco Hidden Costs of Downtime 2026 report puts average unplanned downtime cost at $15,000 per minute across organizations. The Uptime Institute's 2024 findings back this up from a different angle: average downtime cost exceeds $300,000 per hour, the same order of magnitude stated a different way. Fifty-four percent of Uptime Institute's 2024 respondents said their most recent significant outage cost more than $100,000. Six-figure incidents are the median outcome in backend engineering. They're the median outcome, and 60% of organizations reported at least one major outage in the past year, per the same report. Incidents are a recurring operating cost that happens to every team, not an edge case that happens to unlucky ones.
Averages flatten meaningful variation, too. A per-minute downtime figure is calculated across every industry from retail to healthcare to logistics, and revenue exposure varies significantly by business model, since transaction volume and contract penalties differ widely across industries and team types.
None of this is news to a CFO. Revenue-loss math is the easiest MTTR cost to calculate, because it maps directly onto numbers finance already tracks: transactions per minute, average order value, contractual penalty clauses. That's exactly why most organizations stop there. It's the visible tip of the iceberg, the part that earns a line in the board deck. The mass underneath, coordination overhead, engineer labor, retention drag, never gets measured with the same rigor, mostly because nobody has built the dashboard for it yet.
The coordination tax: time lost before troubleshooting even begins
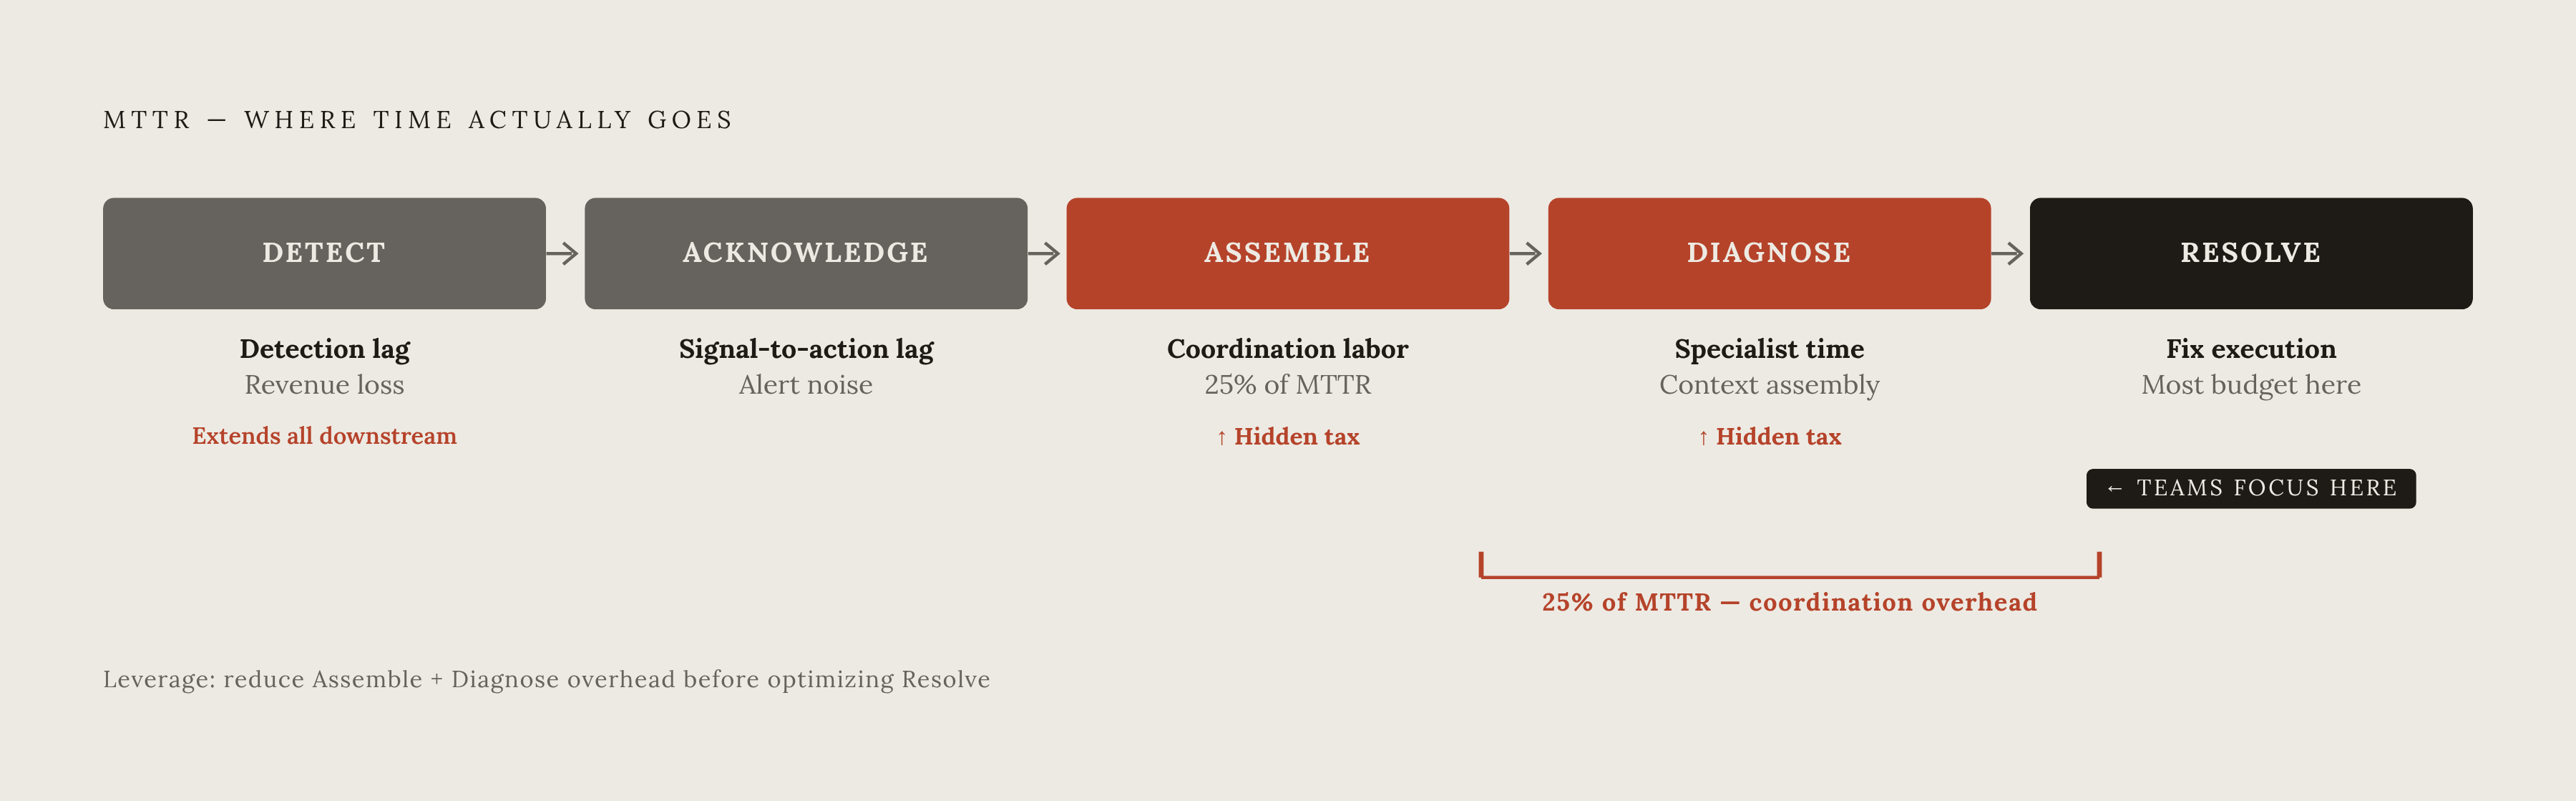
Breaking an incident into its component phases reveals a different picture. Time-to-Detect, Time-to-Acknowledge, Time-to-Assemble, Time-to-Diagnose, Time-to-Resolve: five distinct phases, each running for a different reason. Coordination overhead, the work of pulling people together, finding context, switching between five tools to figure out who owns what, lives almost entirely in Time-to-Assemble and bleeds heavily into Time-to-Diagnose.
Analysis of incident data shows this coordination tax consuming up to 25% of total MTTR. Run the math on a mid-size team: 50 engineers handling 15 incidents a month at 45 minutes apiece burns roughly 168 engineering hours a month on coordination alone, according to that same analysis. At a loaded cost of $150 an hour, that's $25,200 a month spent before anyone has actually started diagnosing the problem.
What does that waste look like on the ground? A Slack channel gets manually spun up by someone. Someone hunts through a schedule to find who's actually on call tonight. Someone digs up the right runbook, which may or may not be current, then pastes dashboard links one at a time into a thread while the incident clock keeps running. None of this is diagnostic work. It's logistics, and it's the same logistics every time, run by hand, producing the same lag every time.
Calling this a discipline problem misses the mechanism. No amount of engineer diligence fixes a process with no automation behind it. The DORA performance tiers make that visible: elite teams recover in under an hour, high performers within a day, medium performers somewhere between a day and a week. Something other than elite teams having smarter engineers explains that gap. It's explained by elite teams having automated the assembly step so thoroughly that it barely registers as a phase anymore.
Engineer time as a direct cost line, not a soft overhead
Scale the coordination waste up to a full engineering org and the number stops looking like overhead and starts looking like a line item. Operational waste from poor incident management runs to a substantial sum each year for a 250-engineer organization, and that's the standing cost of running incident response the way most teams currently run it, not the cost of any single incident.
Loaded engineering cost isn't salary divided by hours worked, either. On-call premiums add up. Context-switching penalties compound every time a senior engineer gets pulled off a sprint mid-task to join a war room, and that pulled engineer raises a cost that becomes visible two sprints later as a missed deadline, never tied back to the incident that actually caused it.
Alert noise makes the whole problem worse before engineers even reach a real incident. Teams field over 2,000 alerts a week, and only 3% need immediate action. Engineers spend a meaningful chunk of their week just sorting signal from static before real diagnostic work starts at all. Splunk's 2025 State of Observability report found that 73% of organizations experienced outages linked to alerts that got ignored or suppressed. Alert fatigue doesn't just waste time. It directly causes the longer, costlier outages that follow it. Vectra AI's State of Threat Detection survey, with 2,000 respondents, found that 67% of alerts get ignored daily. When real signals get buried under that much noise, MTTR climbs not because engineers are slow, but because detection itself has degraded.
The five-phase model earns its keep here. Instrument each phase separately, and a team can find exactly where its own labor cost is piling up, instead of guessing.
The retention drag that never shows up in incident postmortems
Toil rose to 30% of engineer time in 2025, up from 25%, marking the first increase in five years according to runframe.io's state of incident management research. That reversal breaks a five-year downward trend, turning toil back onto an upward path just as alert volume and system complexity keep rising. Toil had been trending down for half a decade, and now it's climbing again, right as alert volume and system complexity both keep rising.
Google's SRE Book sets a toil ceiling of 50% of an SRE's time, with the industry average sitting closer to 33%. Teams pushing past that threshold are operating in what amounts to attrition territory, whether or not anyone on the leadership team has named it that way yet.
The math on nighttime pages isn't proportional. A handful of 2 a.m. pages doesn't cost a handful of hours. It costs disproportionately more in well-being and eventual attrition, because each page tells the engineer holding it that the system they're responsible for isn't reliable. Constant context-switching during business hours destroys focus. Missed alerts, buried under noise, extend outages. Fatigue from being overloaded degrades the quality of decisions made mid-incident. Each of these compounds into the next, and the cumulative toll, not any single bad night, is what actually drives someone to leave.
Attrition cost is real and almost never gets attributed back to MTTR. Replacing a departing engineer carries real costs once recruiting, onboarding, and the lost institutional knowledge of how this particular system actually breaks get factored in. An incident postmortem does not capture any of that. It appears months later as a headcount gap, usually blamed on compensation benchmarks or vague culture concerns, when the actual driver was three months of 3 a.m. pages for the same misconfigured alert threshold.
That asymmetry is the whole problem in miniature. Downtime revenue loss lands on finance's desk within hours of the incident closing. Attrition from on-call burnout appears as a resignation letter months later, disconnected from the incidents that caused it. Teams that optimize revenue exposure while ignoring toil accumulation are still paying the full bill. They're just paying it later, and invisibly, in a different budget line.
Where optimizing one MTTR phase compounds savings across the others
The five phases run in sequence, not in parallel, so a delay in one phase pushes back the start of every phase after it. A slow Time-to-Detect doesn't just cost detection time. It extends every downstream phase, because the incident has already been running for a while by the time anyone even knows it exists. That makes detection speed the highest-leverage investment in the chain: shrink the detection window, and every phase after it inherits a smaller problem to solve.
Post-deploy verification is one of the more direct ways to buy back that detection speed. Evaluating a deployment against the live environment immediately after release, checking core features, API responses, latency, error rates, catches a regression before it matures into a customer-facing incident. Smoke tests and synthetic monitoring do similar work: they catch a bad deploy before it triggers the alert storm that later shows up as coordination overhead, engineer toil, and alert fatigue, all from a single root cause.
IBM's 2025 data on this is instructive. Organizations using AI and automation in their incident lifecycle cut their breach lifecycle by 80 days, compressing the time between detection and containment. That saving isn't concentrated in the resolve phase. It spans detection and response together, which is the point.
AI-assisted root cause analysis shortens Time-to-Diagnose by correlating logs, metrics, and deployment history automatically, instead of asking an on-call engineer to hold all three in their head at 3 a.m. A graph-based model that traces a downstream API timeout back through three services to a database connection pool exhaustion event changes what diagnosis demands of the engineer. It stops being detective work. It becomes a lookup.
Automated postmortems matter for a less obvious reason: they close the feedback loop that keeps MTTR from improving at all. Without a captured timeline of what happened and in what order, teams repeat the same coordination failures on the next incident, because nobody wrote down that the same failure happened last time too.
Tool consolidation belongs in this conversation as well. Every additional context switch during an active incident, another tab, another login, another dashboard on a different time zone setting, is time the SLO clock keeps burning. Fragmented tooling inflates Time-to-Diagnose even when every individual tool in the stack is genuinely good at its job.
What automated production verification changes about the cost equation
A structural gap sits in the middle of most engineering workflows. Merging a pull request and verifying that it actually works in production are two separate acts, and most teams only reliably do the first one. A green CI pipeline confirms the code compiles and passes its tests, nothing more. It says nothing about how real user traffic behaves against that code five minutes after deploy, which is the only ground truth that actually matters.
Production verification platforms sit in the gap between a pull request and a live incident. They check every deploy against real telemetry automatically, catch a regression before a human gets paged, and in some cases open a fix pull request on their own before an engineer even knows there was a problem. That compresses three phases at once. Because verification happens right after deploy instead of after the first user complaint, Time-to-Detect shrinks. Time-to-Assemble shrinks because there's no war room to build when a fix PR is already sitting open. Time-to-Diagnose shrinks because the telemetry context is already attached to that PR, instead of scattered across four separate dashboards.
OnePatch operates in exactly this layer: automated PR verification against live production telemetry, autonomous fix PR generation, and incident response that doesn't require an engineer to context-switch across a half-dozen tools to figure out what broke. The pricing model backs this up. Charging per incident rather than per seat ties vendor incentive more directly to actual MTTR reduction, not to how many logins a company can sell into an org chart. Most tooling in this space gets paid whether or not the incident count ever goes down.
The stakes on this are rising fast. Gravitee's State of AI Agent Security research found that 88% of organizations running AI agents in production reported some form of incident tied to that usage. Code shipped at agent speed, generated and merged faster than any human review cycle can keep pace with, makes automated production verification a first-class safeguard rather than a nice-to-have bolted on afterward.
The 2025 DORA survey, covering nearly 5,000 tech professionals, found that only 16.2% of organizations achieve on-demand deployment frequency, and just 8.5% hit elite-level change failure rates. That gap, between shipping fast and shipping in a way that's actually verified, is exactly where the compound MTTR cost piles up. Teams that keep treating MTTR as a stopwatch reading will keep polishing the one phase they can already see on a dashboard. Teams that treat it as what it actually is, a compound cost running across detection, coordination, engineer time, and retention, will instrument all four. They're the ones who'll find that production verification, not the resolve phase, is where the compounding actually starts.