Measuring On-Call Burnout Before Engineers Quit
Early warning signals hidden in your alert data predict burnout months before resignations.
At 2:13 AM, an on-call engineer wakes to four pages in four minutes. All four resolve on their own before a laptop even opens. On-call burnout is not a mood that shows up out of nowhere at resignation. It builds through a measurable accumulation of operational signals, often months before anyone types a resignation letter.
The line "engineers don't quit jobs, they quit their on-call rotations" has become a common refrain in engineering circles, and it points at something true. It doesn't tell a team which rotation conditions to actually track, so it functions only as a slogan. A 2025 Catchpoint report found that nearly 70% of SREs said on-call stress contributed to burnout and made them more likely to leave. That figure places on-call stress at the center of attrition, not at its edges.
The mechanism driving this is the combination of volume and meaninglessness, not just the number of pages an engineer receives. Getting paged repeatedly for conditions that resolve themselves, or that require no action at all, wears down an engineer's trust in the pager faster than high page count alone ever could. Once that trust is gone, every page carries the same flat emotional weight, whether it's noise or a genuine emergency.
Attrition, once it starts, feeds itself. When a platform team loses two or three engineers in a short span, the remaining engineers inherit a heavier rotation. That heavier rotation produces exactly the stress that drove the first departures, and the next round of exits follows close behind. Burnout on an on-call team rarely stays contained to one person; it moves through a roster the way the sleep debt it causes moves through a single week.
The wrong signals engineering leaders watch
Most engineering leaders learn about burnout through signals that only arrive after the cost has already been paid: exit interviews, quarterly engagement surveys, and sudden clusters of resignations. Each of these tells a true story, but it tells it late.
Exit interviews confirm a cause only after an engineer has already decided to go. By the time someone sits down to explain why the rotation broke them, the decision is made and the information is retrospective by construction. Engagement surveys fare a little better but not much: most run quarterly, and a rotation can degrade sharply over six weeks. The damage stays invisible for an entire cycle before it ever reaches a dashboard.
The metrics most teams do report, raw page count and mean time to resolution (MTTR), measure what happened during an incident. They say nothing about whether the person who handled it is approaching a breaking point. A team can hold MTTR steady for months while the engineers rotating through on-call get quietly worn down by the way each incident unfolds, not just how long it takes to close.
The instinctive response, redesigning the rotation schedule, addresses frequency without touching signal quality. A 2026 playbook analysis states that redesigning a rotation without fixing the alerts underneath it is rearranging furniture, because what pages an engineer determines how tired that engineer gets, not how often the pager changes hands. A team can cut shift length in half and still burn people out if every shift is full of noise.
The leading indicators that actually predict burnout already exist inside the alerting and incident data most teams collect every day. They sit unused because nobody aggregates them or reviews them as burnout signals.
The four metrics that surface burnout risk before attrition
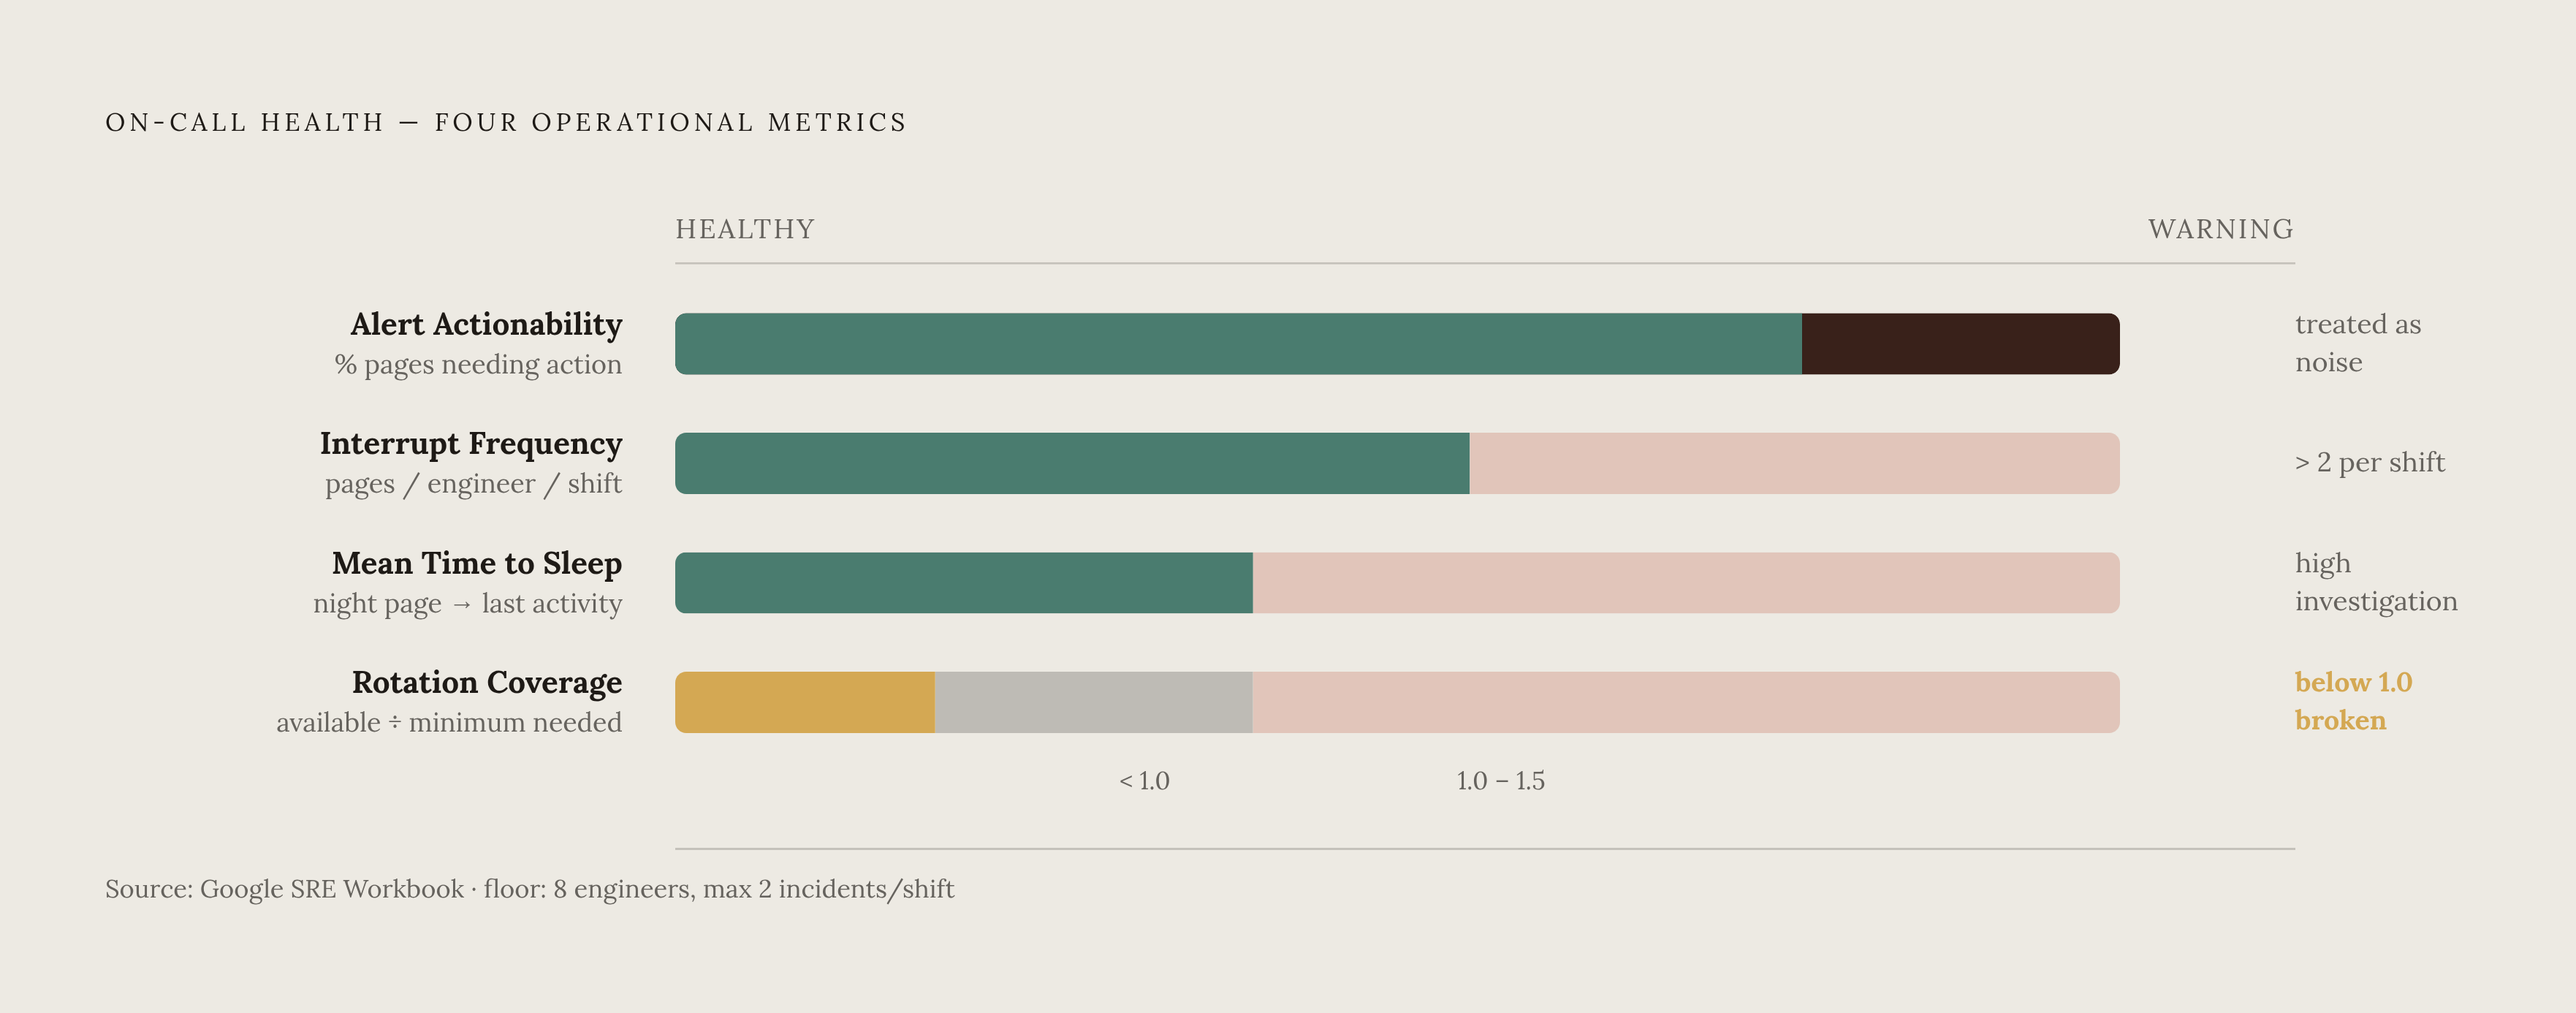
Four operational metrics, taken together, form an early-warning system that reveals burnout risk months before an engineer resigns: alert actionability rate, interrupt frequency, mean time to sleep, and rotation coverage ratio.
Alert actionability rate measures the percentage of pages that result in a meaningful human action, as distinct from alerts that auto-resolve, require no response, or get silently acknowledged and forgotten. When this rate drops below a healthy threshold, engineers start treating every page as probably nothing. That desensitization is the exact cognitive state that causes a real P1 to get missed. The metric requires no new instrumentation to compute. It sits inside any alerting tool's event log already, waiting on someone to aggregate it with intent.
Interrupt frequency counts total pages per engineer per shift, segmented by time of day, with the after-hours and sleep-hours subset carrying the most predictive weight. A sustainable rotation is one where most shifts can be slept through. Google's SRE Workbook recommends a maximum of two incidents per on-call shift as a baseline for sustainability, and a rotation running well above that is structurally unsustainable no matter how clever the scheduling looks on paper. Segmenting this number by individual engineer, not just by team, reveals whether the burden spreads evenly or concentrates on the few senior engineers who own the most complicated services.
Mean time to sleep, MTTS, measures the average elapsed time between a night page and the engineer's last documented activity, whether that's a final Slack message, a last terminal command, or an incident closure timestamp. This is a proxy for how long sleep is actually disrupted per incident, and it can be derived from the timestamps already sitting in any team's incident channel without new tooling. A page that wakes someone at 2 AM and resolves in four minutes produces a very different MTTS than a page that triggers a two-hour investigation before the laptop finally closes. What drives MTTS up is usually investigation time, not resolution time: engineers spend more of the night hunting for context across dashboards, logs, and deployment history than they spend actually fixing anything. That points straight at tooling gaps, not scheduling gaps.
Rotation coverage ratio compares the number of engineers available for a rotation against the minimum needed to sustain it humanely. The Google SRE Workbook sets that floor at eight people for single-site, 24/7 coverage. Fall below it, and each departure forces the remaining team into a frequency nobody can sustain for long. A ratio below 1.0 means the rotation is already broken. A ratio between 1.0 and 1.5 means the team is one or two departures away from falling below the floor, a fragility that exists as a burnout risk independent of how many pages are currently coming in. Coverage ratio also catches a subtler failure: a team of six people covering twice as many services as it used to is not the same team of six it was a year ago, even if the headcount on paper hasn't changed. A 2025 survey of 1,200 platform engineers found that a majority handle on-call duties for more services simultaneously than is sustainable, with a significant share responsible for a very high number of services each. Coverage ratio has to account for that expanding scope, not just the raw number of names on the schedule.
Reviewed together, these four numbers form a leading-indicator dashboard that a team can walk through in a short weekly meeting, the kind of lightweight, recurring check that catches a bad pattern while it's still a pattern and before it turns into an attrition event. A simple table, listing each metric alongside its definition, a healthy reading, and a warning reading, would make this dashboard easy to build directly from the material above.
Tools that tie alert context to recent deployments and pull-request history can shrink the investigation window inside MTTS considerably, which cuts directly into the physiological cost of a bad page. Production verification that tracks what actually changed in a live system, rather than leaving an engineer to piece that together from five open tabs, is a real lever against burnout.
How alert noise inflates every metric simultaneously
Alert noise isn't one input among several that drives burnout. Alert noise is the upstream condition that degrades actionability rate, inflates interrupt frequency, extends mean time to sleep, and erodes coverage ratio, all at once, which makes it a root cause rather than four separate problems in need of four separate fixes.
Once most pages stop being actionable, engineers lose trust in the pager itself. They begin to treat every incoming alert as probably noise, and that is precisely the mental state in which a real P1 slips through unnoticed. A 2025 Splunk study of UK IT teams found that 73% of organizations had experienced outages due to ignored or suppressed alerts. That number says alert noise is a reliability risk sitting right alongside being a burnout driver.
Alert hygiene works as a recurring habit. After every on-call rotation, each alert that fired deserves a label: actionable, false positive, informational, duplicate, or self-healing, with the catalog updated to reflect what was learned. Engineering leaders often push back on cutting any alerts at all, worried that something important might slip through if the volume comes down. An alert that nobody ever acts on isn't catching anything; it only adds to the noise floor that buries the alerts that do matter.
A tooling problem, not a scheduling or morale problem
The instinct to fix on-call burnout through better scheduling and morale programs addresses symptoms that trace back to a deeper tooling gap. The four metrics above trace back to gaps in tooling that no amount of schedule redesign can close on its own.
Scheduling changes cut how often an engineer sits on call, but they don't change what happens during a given shift. A shorter rotation running against the same noisy alerts and the same investigation overhead still produces a high MTTS and a low actionability rate. The tooling failure is most visible in the investigation bottleneck: on-call engineers spend more time hunting context across dashboards, logs, and deployment history than they spend executing the actual fix. That's a problem of assembling context, not a problem of an engineer's ability to resolve something once the cause is clear.
Tool sprawl makes this worse. The 2026 State of Production Reliability and AI Adoption Report found that 83% of organizations juggle four or more separate tools during a live incident. An engineer waking at 2 AM who has to open several tools just to line up a deployment event against an error spike and a latency graph is spending every extra tab open as time the incident stays unresolved and sleep stays interrupted.
Morale programs and on-call compensation have a real place here. Fair pay for carrying a pager is a baseline requirement for a sustainable rotation, not a nice extra. But none of that changes alert actionability rate or interrupt frequency. These measures make a damaging experience more bearable without making it less damaging. A team that loses several platform engineers and responds by spreading their scope across the survivors hasn't solved anything either: coverage ratio gets worse while every other metric stays exactly where it was.
What actually moves these numbers is tooling built for the problem directly. Automated alert classification cuts down the noise feeding into actionability rate. Deployment-aware alerting, which surfaces which pull request shipped right before an error spike, collapses investigation time and with it MTTS. Runbooks attached directly to alerts remove the context-hunting step from the equation.
Tools that automatically surface post-deploy regressions as structured incident data, instead of adding to the alert noise, can break the cycle where meaningless pages accelerate attrition. One Patch's production verification model, which monitors live telemetry to separate actionable signals from noise, shows how continuous signal assessment can feed straight into an operational dashboard without someone manually digging through logs or waiting on the next quarterly review.
Alert actionability rate is straightforward to compute from alerting logs alone. Connecting alert behavior back to the production events that actually caused it is harder. Platforms that verify deployments against live telemetry automatically can enrich that metric by identifying which pages trace back to a post-deploy regression versus which ones are chronic false positives repeating week after week, giving a leader a clearer read on whether alert fatigue on their team is a detection problem or a volume problem.
AI-generated code at agent speed is making unmeasured burnout more dangerous
Agentic development is increasing both the volume and the ambiguity of production changes faster than on-call rotations are built to absorb. Teams that aren't measuring the four metrics above are going to find themselves overwhelmed before the dashboards even flag a problem.
More code is shipping faster, with less clarity about who actually owns it. When an AI agent generates and merges a pull request, the on-call engineer who inherits the resulting incident may have no context on what that code was supposed to do. Ownership ambiguity at 2 AM drives MTTS upward during investigation: without knowing who wrote a change or why, an on-call engineer can't route the question to an expert, can't lean on a mental model of how the system is supposed to behave, and has to reconstruct the whole picture from logs alone.
Knowledge silos, where only one engineer truly understands a given service, have always been a known rotation risk. Agentic code generation creates a new version of that same risk, one where nobody fully understands a service because the code's author was an agent rather than a person who can be asked questions on Monday morning.
The compounding effect is sharpest when a wave of meaningless pages lines up with a recent deployment. Teams that can automatically detect post-deploy regressions and surface them as structured incident data, rather than as another string of alerts to sift through, break the cycle where alert fatigue accelerates engineer attrition. The right response to agentic development is to treat automated production verification, checking every merged pull request against live telemetry, as a standard safeguard between the moment code ships and the moment it reaches production, catching regressions before they ever become a page that wakes someone up.