Production Incident Impact on User Retention Metrics
Incidents trigger silent churn weeks before dashboards catch the financial damage.

Production incidents don't stop mattering once the status page turns green. They set off a chain reaction through retention metrics that runs quietly for weeks, and by the time anyone sees it on a dashboard, the damage is already priced in. This piece traces that chain step by step, from the moment a user hits a broken flow to the moment it shows up as a hole in ARR, so engineering teams can start treating reliability as a retention variable instead of just an uptime number. Production Incident Impact on User Retention Metrics.
Retention metrics look healthy right before an incident destroys them
A CS manager sees DAU up, NPS positive, and renewal forecast green, and the account churns four weeks later. That sequence isn't a fluke or a forecasting error. Userpilot's Agent Analytics work identifies the actual cause in a growing number of these cases as an AI agent wired into the product through MCP that quietly stopped completing tasks three weeks before any human-facing metric caught it monday.com.
It's about what retention dashboards are built to do: report damage after it accumulates, not while it's happening. They're trailing instruments, and production incidents exploit that lag on purpose, or at least exploit it without anyone noticing. The disruption itself takes minutes. The metric takes weeks to catch up.
The organizational split underneath this is straightforward once you say it out loud. Engineering teams don't think of themselves as retention owners, and retention teams don't have visibility into production events. So the chain runs uninterrupted between two teams who are, quite literally, not looking at the same screen. What follows is a map of how that chain runs, step by step, from incident to churn to degraded NRR to lost ARR.
The retention metrics that incidents move
Start with a distinction that gets collapsed too often: user retention and customer retention are not the same thing, and the gap between them is where incidents do their quiet work. User retention tracks product usage, logins, feature adoption, task completion, session frequency. Customer retention tracks the financial relationship: renewals, paid status, whether the account still exists. A customer can renew a contract while the humans inside that account have stopped opening the product, and that gap is what a bad incident produces. The contract holds. The expansion never comes.
Net Revenue Retention is the metric that ties all of this together, because it captures expansion, contraction, and churn in a single number, and it's the number investors use to judge whether a SaaS business is actually healthy. Below 100%, the existing customer base is shrinking before a single new logo gets counted, and that is precisely the threshold incidents push teams across without anyone deciding to cross it EverHelp.
ARR sits downstream of all this as the accumulator. Every point of churn, every suppressed expansion deal, lands here eventually, and at scale the multiplier effect is not subtle. Well-run B2B SaaS businesses hold 85% to 95% annual retention monday.com. A five-point drop from that range isn't a rounding error; it's a material ARR problem for any company with real scale monday.com. None of these are abstract finance numbers dreamed up in a board deck. Each one has a specific behavioral precursor, and production incidents trigger that precursor directly.
Step one of the chain: how an incident registers in user behavior before any metric moves
Nobody cancels a subscription the moment a page fails to load. What happens instead is behavioral withdrawal: the session ends, the user closes the tab, and some fraction of them simply don't come back that day. Power users get hit hardest, which is the cruel part, because they're the ones pushing the product hardest, and they're also the ones with the most expansion potential sitting on the table.
In B2B accounts, the person who actually hits the broken flow is rarely the economic buyer signing the renewal parallelhq.com monday.com EverHelp / AppsFlyer and Statista data. But the frustration doesn't stay contained. It travels upward through support tickets, a Slack message to the internal champion, a flag that shows up in the next quarterly business review. An incident doesn't just interrupt a task. It forces a user to consciously ask whether this product can be trusted with real work, and that reconsideration, not the outage itself, is the actual retention risk.
Timing makes this worse. Pushwoosh's analysis shows many apps lose 77% of daily active users by day three after install, and an incident that lands during early onboarding compresses that already-brutal window even further. And 2026 has introduced a genuinely new failure mode: AI agents connected through MCP fail silently monday.com. No error message, no support ticket, no human in the loop noticing anything. The agent just stops returning results, and the account looks perfectly healthy on every human-facing dashboard until, suddenly, it doesn't monday.com. The behavioral damage from an incident is front-loaded. The metric damage is back-loaded. Intervening during that first window is the only point where the chain is still stoppable.
Step two: how behavioral withdrawal accumulates into measurable retention signal
Cohort analysis is the tool that makes this visible, and it's underused for exactly this purpose.
Feature abandonment is an early tell. A user who hits an incident while trying out a new feature usually doesn't come back to try it again. The adoption curve for that feature flattens, and whatever expansion revenue it was supposed to generate simply never materializes. Reduced session frequency and falling feature usage aren't side effects of churn, they're the behavioral precursors to it, and both are direct, measurable outputs of a bad incident experience.
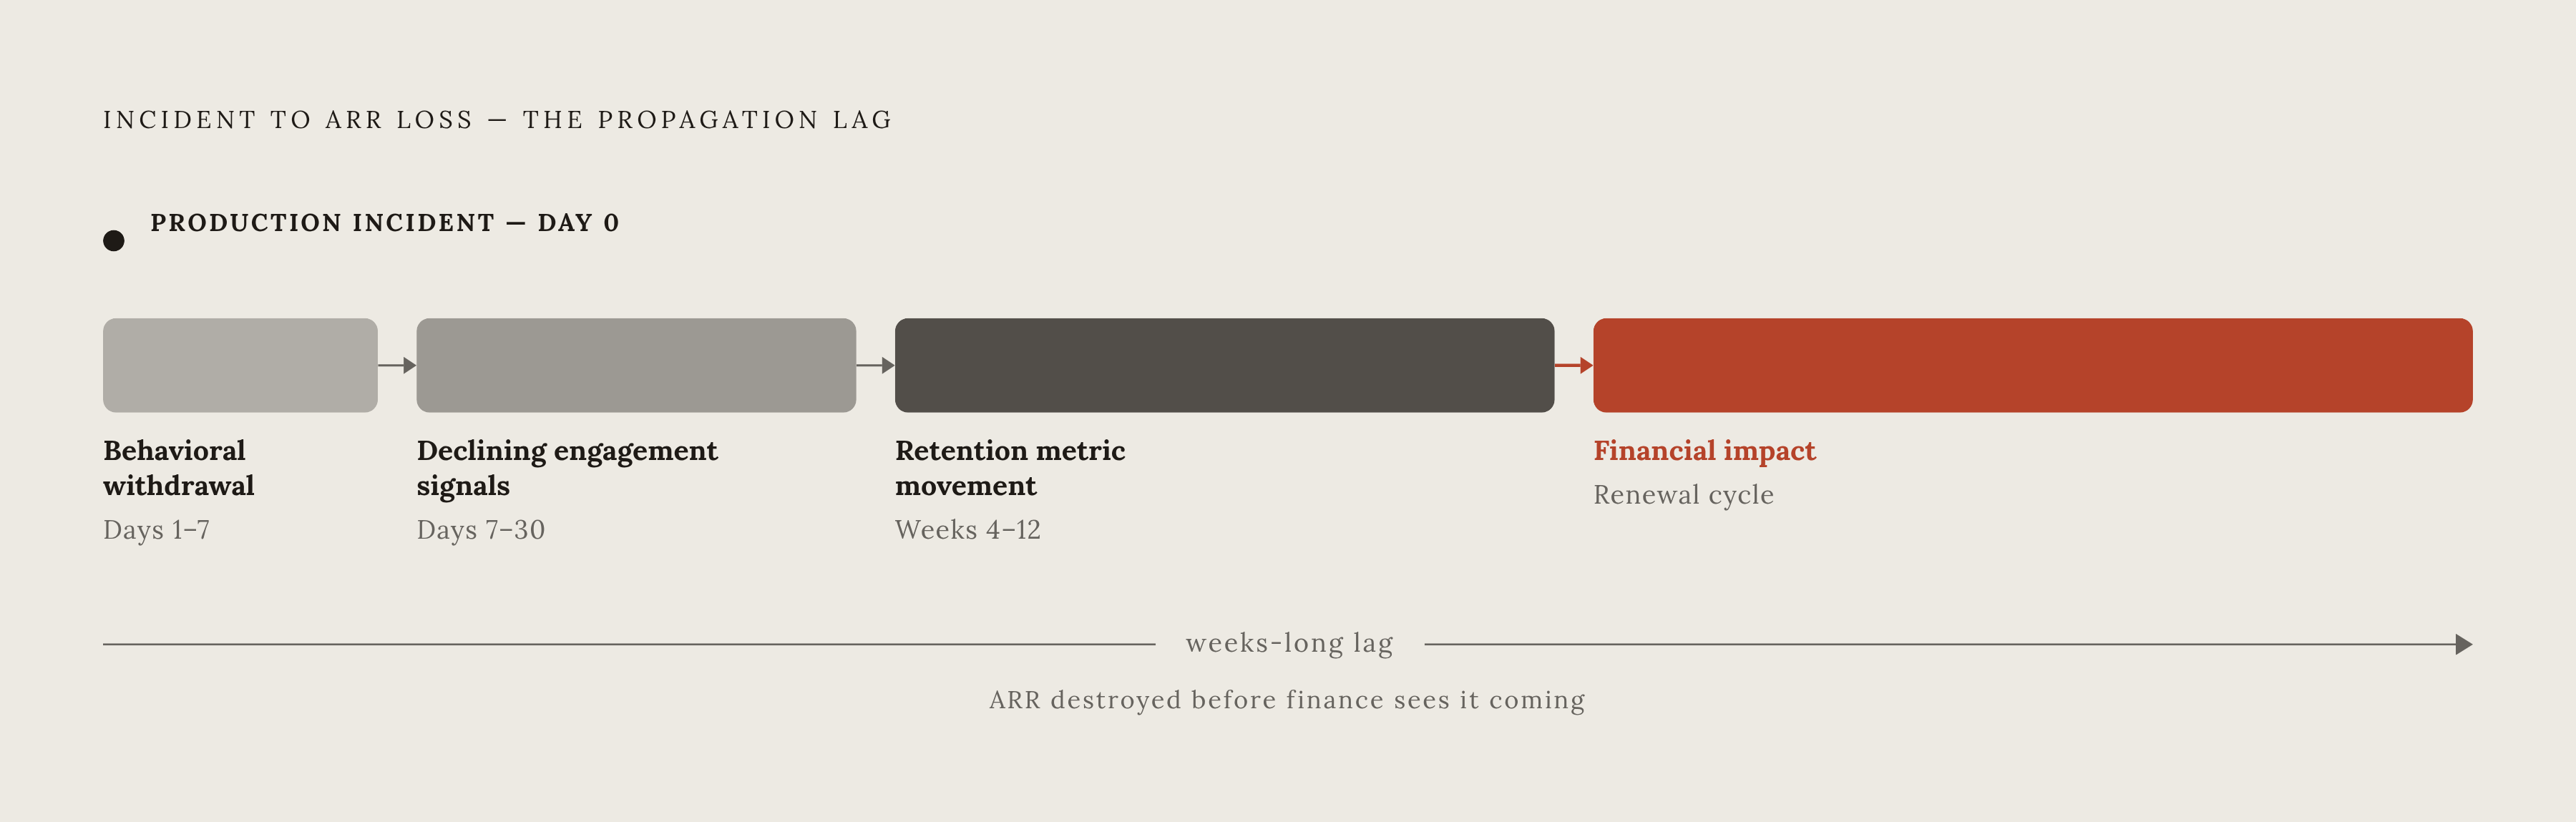
Most teams miss this because the tooling doesn't connect the dots. Standard dashboards show aggregate DAU and MAU; they don't correlate an activity dip to a specific deploy or a specific outage window, because the incident data and the behavioral data live in different tools, read by different teams. Running two separate streams makes this worse for any account running agents in production: human engagement metrics can look stable while agent task completion is collapsing underneath them, and per Userpilot's Agent Analytics work, those are exactly the accounts most exposed to surprise churn monday.com. Annotating deployments and production events on the same timeline as retention metrics is the one diagnostic step most organizations haven't taken, and without it, the causal line between "we shipped this" and "retention dropped" stays invisible. The lag structure unfolds as behavioral withdrawal in days 1–7, declining engagement signals in days 7–30, retention metric movement in weeks 4–12, and financial impact in the renewal cycle. Cohort analysis is the tool that makes this visible, segmenting users by the week an incident occurred and tracking their retention curve against a clean cohort, with the separation often not appearing until day 14–30, as Pushwoosh's cohort-based retention methodology shows.
Step three: how degraded retention flows through to NRR and ARR
NRR compresses through three separate mechanisms at once, and incidents pull all three levers simultaneously monday.com. Expansion slows because users don't adopt new features from a product they've started to associate with instability. Contraction accelerates because power users downgrade or cut seats. Churn probability rises across the board. None of these require a mass cancellation event to matter.
There's a cost-multiplier effect hiding inside every churned account, too. It's qualitatively far cheaper to keep a customer than to acquire a new one, and every account that walks after an incident takes more than its own ARR with it: the referral it might have generated, the case study it might have become, and the acquisition cost that never gets recovered. Expansion revenue is the most invisible casualty of all, because a customer who would have upgraded doesn't produce a "lost" line item anywhere. Nobody sees the deal that didn't happen. The ARR impact only becomes visible once the annual model gets rebuilt and the number comes in short.
Userpilot's CEO has pointed to a structural reason this is getting worse, not better: teams are now shipping seven, eight, or nine features a quarter, up from one or two historically, because AI is writing a growing share of the code. More features means more surfaces where something can break and more retention levers that can snap at once, and the frequency of exposure is climbing faster than the measurement infrastructure built to track it. ChartMogul puts elite NRR at 115%–125%, and monday.com puts a well-run B2B SaaS's target annual customer retention at 85–95%, meaning incidents don't have to cause mass cancellations to push a team out of the elite band, since suppressed expansion alone is enough, as parallelhq.com, monday.com, EverHelp / AppsFlyer, and Statista data show EverHelp / AppsFlyer and Statista data. NRR below 100% is the threshold that signals the business is shrinking before a single customer is added, and incidents that suppress expansion without causing visible churn can silently push a team across this line, according to EverHelp.
The measurement gap between production and retention lets the chain run uninterrupted
The organizational chart is the root cause here more than any single tool. Production telemetry lives with engineering. Retention metrics live with product and customer success. In most companies, nobody sits at the intersection reading both at the same time. That is not a staffing oversight, it is a structural blind spot, and it is exactly the gap the chain reaction depends on.
The tooling doesn't help. NeuBird AI's State of Production Reliability report, which surveyed more than a thousand SRE, DevOps, and IT operations professionals, found that 83% of organizations use four or more separate tools during a live incident monday.com Focus Digital. The same fragmentation that slows down incident response is what prevents anyone from correlating a production event with the retention signal it eventually produces monday.com Focus Digital. Alerts are often not actionable on top of that, with 80% of organizations saying half or fewer of theirs actually are, the same report found monday.com Focus Digital. Most teams spend a live incident triaging noise rather than asking what's happening to the users who just hit the failure monday.com Focus Digital.
Legacy retention stacks add a blind spot: they measure human signals well but have no instrumentation for agent task completion, agent return rate, or MCP call success, so an AI agent wired into the product through MCP stopped completing tasks three weeks before the human metrics caught anything monday.com. Userpilot's framework holds that any team that isn't measuring both streams is only measuring half its users monday.com. What's actually missing, technically, is not complicated: deployment annotations layered onto retention dashboards, incident timestamps correlated against cohort curves, and postmortems that include behavioral impact alongside MTTR instead of stopping at root cause. The DORA 2025 State of AI-Assisted Software Development report, based on nearly 5,000 tech professionals, found that only a small fraction of organizations hit elite-level change failure rates monday.com. Most of the industry, in other words, is generating the raw material for this chain reaction on a regular basis, with no instrumentation in place to see where it goes monday.com.
What automated production verification changes about the chain
Merging a pull request and verifying that it actually works are two different events, and most teams only do the first one. The gap between those two moments is where incidents that turn into retention events get born. CI passing tells you the code is syntactically sound and clears its test suite. It tells you nothing about how that code behaves once it meets real user traffic and real data, which is the only ground truth that actually matters.
Automated production verification closes that gap by checking every deploy against real telemetry, metrics, logs, traces, once it's actually live, and catching regressions inside the behavioral window measured in hours rather than the weeks it takes for a metric to move. Instead of waiting for a war-room Slack thread to spin up, a system built this way can open a fix PR automatically, which shortens the intervention window to before the user ever forms that trust judgment in the first place. Watch error rates and latency for the canary against the stable version, and roll back automatically the moment either one degrades, so the incident never reaches the full user base and the chain never gets a chance to start.
Observability itself should be treated as a deployment gate, not an afterthought. If metrics aren't flowing, logs aren't being written, and traces aren't being generated after a deploy goes out, that deployment should fail on those grounds alone, because that's the exact instrumentation gap that lets silent failures, agent failures included, run undetected for weeks. This is the intervention point that matters most: between the PR and the live environment, verifying each deploy against what's actually happening in production, catching regressions before anyone has to get paged, and returning a fix rather than an alert. And the stakes on this keep rising: with AI now shipping seven, eight, or nine features a quarter where one or two used to ship, automated verification is the only mechanism that scales with the rate of change, not merely a nice-to-have.
Instrumentation and metrics for measuring retention impact
Start with deployment annotation: every production event (deploy, rollback, feature flag change) should appear on the same timeline as DAU, session frequency, and feature adoption curves; this is the minimum viable connection between production and retention. From there, add incident timestamps directly into cohort analysis. Build incident-tagged cohorts and compare their 7-day, 14-day, and 30-day retention curves against clean cohorts from the same period, and for the first time the retention cost of a specific incident becomes something you can actually point to.
Instrumentation needs to split into two separate streams, Userpilot's framework holds. Human signals, logins, session frequency, feature adoption, NPS, are the standard stack most teams already have. Agent signals, task completion rate, agent return rate, MCP call success, don't appear in any legacy retention dashboard and have to be added on purpose. Skipping that second stream leaves half the user base effectively unmonitored.
SLOs deserve a rewrite too. An error budget framed as "what failure rate do we tolerate before behavioral withdrawal begins" gives the rest of the organization something to act on, in a way a target framed purely around nines of uptime never does. Postmortems should carry the same shift: every incident writeup ought to include a retention impact section covering the behavioral signals observed, the cohorts affected, the estimated expansion revenue at risk, MTTR, and root cause. That's how engineering teams build real fluency in what their incidents actually cost.
Tool sprawl belongs on this list too, since it functions as an incident risk rather than a mere convenience problem. The NeuBird AI report puts 83% of organizations at running four or more tools during a live incident, and every extra context switch during an outage is more time for the retention damage to keep accumulating in the background monday.com Focus Digital. Consolidating production verification into fewer, better-connected systems cuts MTTR directly, and it also shrinks the behavioral window during which users are quietly deciding whether they still trust the product monday.com Focus Digital.
Sources
- User retention metrics: 10 KPIs to track and improve in 2026
- From metrics to meaning: Making user retention data actionable
- The Complete Guide to SaaS Metrics (2026) | ParallelHQ
- The 2026 SaaS retention benchmarks every founder should know | EverHelp
- Average Customer Retention Rate by Industry: 2026 Report - Focus Digital