Telemetry Blind Spots in Distributed Microservice Architectures
Most teams drown in telemetry while remaining blind to what actually breaks.
Microservice architectures don't just multiply the number of things to monitor. They change the shape of how monitoring itself has to work. A slow request in a monolith points to one log file, maybe one stack trace. Route that same request through 30 to 50 services, an API gateway, an auth check, a catalog lookup, an inventory query, a payment call, and you need a different instrumentation model entirely, because the failure no longer lives in one place.
Three structural properties of microservices build what's best described as observability debt. Each service scales on its own, often unpredictably, so telemetry volume grows past what most stacks were sized to handle. One slow downstream dependency triggers a retry storm, exhausts a connection pool, and appears to the user as a checkout button that just won't respond, and these are failure paths that don't even exist in a monolith. Tracing that chain backward takes trace coverage across every service in the path, including the ones upstream of whichever one finally threw the error. And a stack trace stops cold at the network boundary. Without shared context threaded through every hop, the space between services isn't just hard to see, it's structurally invisible.
None of this comes from teams failing to collect data. Most are drowning in it. Fragmented telemetry buries the signals that matter inside signals that don't, and past a certain point, collecting more information stops producing more answers. A lot of engineering organizations crossed that line already without quite noticing.
The three pillars, metrics, logs, and traces, exist because each answers a different question. Metrics tell you something is wrong. Logs tell you what happened. Traces tell you where in the distributed system it happened. Dropping any one of the three creates a structural blind spot, not just a smaller dataset. The rest of this piece walks through where those blind spots actually form.
Where instrumentation coverage breaks down at service boundaries
Most root-cause analysis assumes full trace coverage across every service in a request path. That assumption rarely holds up in real deployments. Treat uninstrumented services as the default condition, not the exception. They're that common.
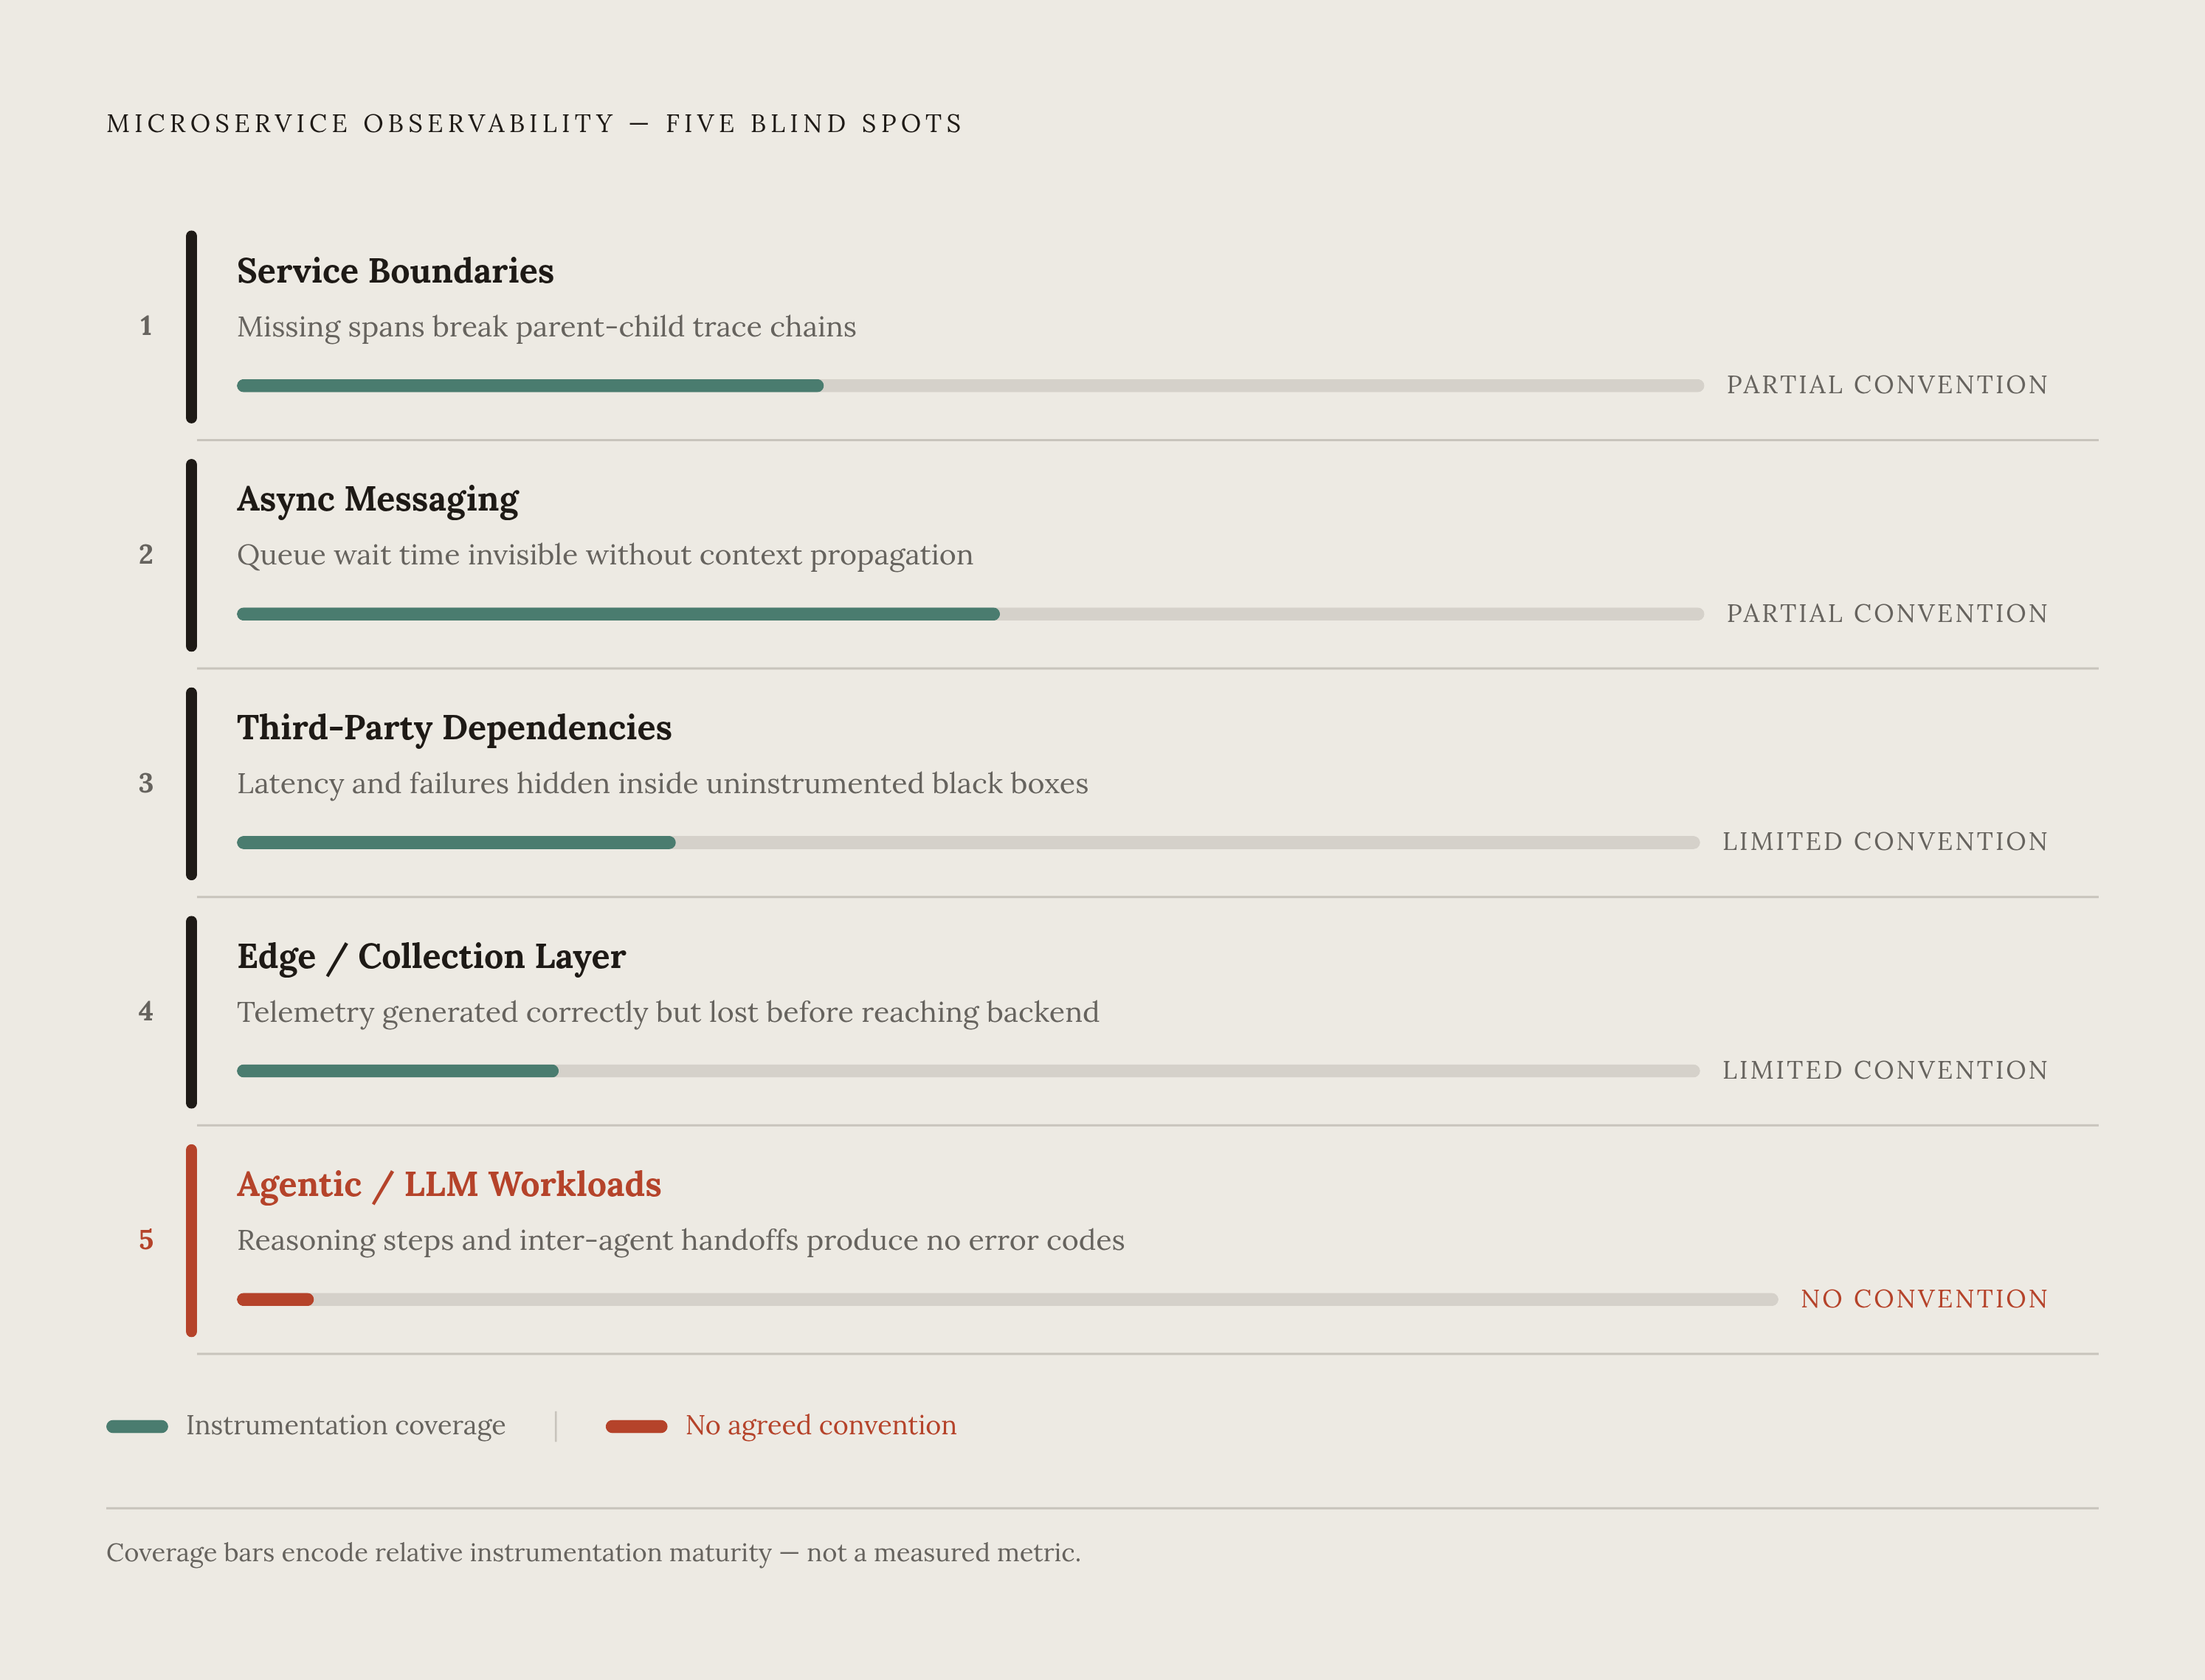
The mechanics are simple once you see them. Trace data goes missing because of instrumentation gaps, or because of network trouble at the moment of collection. Either way, a missing span breaks the chain of request tracking. Without an intact parent-child relationship between spans, there's no way to pin latency or failure on the service actually responsible for it, so the blame lands on whatever service happens to be visible instead.
Full instrumentation covers logic execution, database calls, external API calls, cache access, and queue delays, each one wired in on purpose, not by accident. Services that fall outside standard auto-instrumentation support require someone to add it by hand. And because instrumentation decisions get made incrementally, team by team, service by service, coverage ends up uneven across a system that's supposed to behave as one.
Cardinality makes it worse. Run many services, each with multiple versions across multiple regions, each calling several downstream dependencies, and the count of unique metric time series climbs fast. Some teams respond by setting labeling rules based on what they can afford to store, not what they'll actually need at 2 a.m. when something breaks. Log correlation suffers the same fate: a single user request scatters log lines across dozens of services, and without a shared request ID threading through every line, plus a platform that can query all those streams together, log-based debugging turns into guessing dressed up as analysis.
Even teams that mean well end up with gaps, because instrumentation gets assumed instead of enforced. Nowhere does that assumption fall apart more visibly than in async messaging.
Async messaging and event-driven layers that hide latency and failure
Queues, event buses, and pub/sub systems break the request-response model most APM tooling was built around. There's no continuous thread of execution to follow. No synchronous call stack to unwind. The request just stops existing as a single thing the moment it hits the queue.
Proper async instrumentation has a specific shape. The producer records a span when it puts the message on the queue. The consumer records another span when it starts processing. Both carry the same trace context, so queue wait time, processing time, and any gaps in between become visible, but only if both sides are instrumented and that context survives the trip through the message envelope. Trace context propagation through message envelopes is not guaranteed, and often requires explicit implementation. Someone has to add it by hand, and often nobody does.
The misattributions that follow look plausible right up until you check them. Latency that actually came from sitting in a queue gets blamed on a downstream service. A failure in a consumer becomes visible in the producer as a timeout, which never even learns the message failed. The gap between enqueue and dequeue simply doesn't exist in the data unless somebody built it to.
Sampling sharpens the problem further. Tail-based sampling, capturing errors and slow requests while sampling only a fraction of the fast, successful ones, fits what async pipelines actually need. But it only works if the observability platform supports it. Without that support, teams face a binary choice: keep too much data and pay for it, or keep too little and miss the requests that mattered.
Service-level health signals tell you the service is responding. They say nothing about what's backing up inside the queue feeding that service. Saturation metrics, connection pool exhaustion, queue depth, consumer lag, need their own instrumentation, and they're usually the last thing anyone adds, right up until the queue backs up and nobody can say why.
Async layers, at least, sit inside a team's own infrastructure. Third-party dependencies don't offer even that much control.
Third-party dependencies as an instrumentation dead zone
Payment processors, identity providers, shipping APIs, CDNs: these sit entirely outside the instrumentation perimeter. A team can see what it sends and what comes back. What happens in between is a black box by design, not by oversight.
The symptoms appear without their causes attached. Latency spikes that look like they start in a downstream service trace back instead to infrastructure trouble inside a third-party API. Intermittent failures that resemble network errors are really the third party responding inconsistently. Timeout patterns are visible only at certain traffic volumes or times of day, and by the time anyone notices, the SLO is already burning.
This class of problem tends to surface only through boundary-level trace analysis, since the third party's own reporting rarely reflects what the calling service actually experiences.
What a team can instrument, even with zero visibility into the third party's internals, is the boundary itself: egress spans from its own services, response time distributions, error code frequency, retry rates. That's the proxy telemetry standing in for a system nobody outside the vendor can actually observe. The trouble is that this proxy telemetry gets treated as optional. Plenty of teams add a circuit breaker at that boundary without adding a span to go with it, leaving the circuit breaker's trip count as the only signal that something went wrong.
SLOs are widely adopted, 86% of organizations report using them, but most treat them as something to report on after the fact rather than something to enforce in real time. Third-party dependencies are exactly the case where enforcing an SLO at the boundary, instead of just measuring against it later, catches the failure while it's still small.
That's the outer edge of a system's boundary. The inner edge has its own version of the same problem, and it starts before data ever reaches the backend.
Edge infrastructure and the telemetry collection gap before data reaches the backend
This blind spot involves telemetry generated correctly and then lost, delayed, or diluted before it ever reaches anything capable of analyzing it.
Hundreds of ephemeral pods generating log volume simply overwhelm the collection agents assigned to gather it in high-density container environments. Edge nodes and IoT or OT environments bring a different failure mode: intermittent connectivity fills telemetry buffers and forces older data out to make room for new. Service meshes add their own pressure, generating sidecar telemetry at volumes that strain cost and bandwidth, which pushes teams toward aggressive sampling that quietly throws out the rare, meaningful signal along with the noise.
There's a real payoff waiting at the collection layer, if it's done with intent. Filtering and enriching telemetry before it reaches the backend has cut data volumes by 50 to 70% in production deployments, more than halving backend costs without losing the signal that matters. But that result depends entirely on a deliberate strategy. Teams that filter without one end up throwing out the wrong data, and they usually don't find out until the exact moment they needed it.
Sampling decisions made at this layer create blind spots of their own. Head-based, random sampling loses rare events and low-frequency failures by definition, since randomness has no way to know which requests are worth keeping. Aggressive rate limiting at the agent level throws out slow requests, which happen to be the most diagnostically useful ones available. Without tail-based sampling support built into the platform, teams keep landing on the same choice between cost and coverage.
The OpenTelemetry Collector is emerging as the place where these decisions actually get made. Advanced Collector pipelines are increasingly being used as the place where sampling, filtering, enrichment, and modification of telemetry happen right at the source. That makes the Collector the lever controlling what reaches the backend and what gets thrown away before anyone even knows it existed.
The compounding effect matters here. When data gets lost at the edge, the three-pillar system goes incomplete because collection itself failed, and the backend has no way of knowing what it never received.
AI-generated and agentic workloads as a new category of blind spot
LLM-powered applications and autonomous agents don't behave like the software most observability tooling was built to watch. Deterministic HTTP paths, 5xx errors, latency across stateless request flows: these signals are still necessary, but they've stopped being enough on their own.
Traditional APM has no visibility into several things that matter enormously in agentic systems. Reasoning steps and intermediate decisions made between tool calls stay invisible to span-based tracing, because there's no span built to hold them. Semantic failures slip through entirely: a response can be syntactically perfect and still be factually wrong or behaviorally unsafe, and none of that trips an error code for anything to catch. Inter-agent handoffs, where one agent's output feeds straight into another's input, recreate the same boundary problem seen in service-to-service calls, except there's no standard convention yet for propagating context across that handoff. And the prompt and completion content itself, the actual inputs and outputs of an LLM call, carries security risk, prompt injection, data exfiltration, that no latency metric was ever built to catch.
Agentic systems need first-class telemetry that most observability stacks don't collect yet: prompts, the external API calls an agent makes on its own initiative, which tools it picked and what came of that choice, and the intermediate reasoning steps connecting one decision to the next.
Investment in open standards for agent communication and transparency is set to grow, and OpenTelemetry looks positioned to be part of that answer. But right now, agentic observability conventions are still being worked out, not settled into anything resembling a standard. Teams shipping agent-powered features today are instrumenting into a gap that doesn't have an agreed-upon shape yet.
That gap matters because agentic code ships at agent speed: non-deterministic, without semantic error codes, tested against criteria that don't map cleanly onto production behavior. That's the exact condition where the distance between a passing CI pipeline and reality in production runs widest, and where uninstrumented blind spots do the most damage.
OpenTelemetry's rise and the gaps it narrows but doesn't close automatically
OpenTelemetry has become the de facto open standard for telemetry, with 49% of organizations running it in production and another 26% evaluating it. It ranks as the second-highest velocity project in the CNCF, trailing only Kubernetes itself. That's most of the industry moving in one direction at once.
What OTel actually fixes is real and deserves to be named. It kills off duplicate instrumentation, custom agents, and vendor-specific SDKs, repetitive setup work that pays back nothing beyond getting the lights on. Spans exported over an open protocol move between backends without re-instrumenting every service, which takes vendor lock-in off the table as an excuse for under-instrumenting. Semantic conventions give teams a shared vocabulary for what a span actually represents across a polyglot stack, cutting down the cardinality noise that comes from five teams labeling the same concept five different ways. And enhanced SDKs and collectors bring auto-instrumentation to languages and platforms that had none, lowering the barrier for services that were blind spots simply because nobody got around to them.
Adopting OTel is not the same as closing the gap, and teams keep getting this backward. It can instrument the egress span pointed at a third-party service, but it can't see inside that service, because the standard has no jurisdiction over infrastructure it doesn't control. Message brokers that don't carry trace headers natively still need someone to wire up context propagation by hand. Sampling strategy stays a team decision; OTel hands you the mechanism, but the judgment call about what's worth keeping is still yours to make. Agentic and LLM observability conventions remain in development, nowhere near stable enough to lean on.
The Collector, meanwhile, is becoming the central lever for controlling observability spend, and that cuts both ways. A well-configured Collector pipeline saves real money without losing signal. A misconfigured one is a gap-creation mechanism in its own right, quietly throwing out exactly the data that would have explained an incident.
Adoption at 49% in production means roughly half of production environments are still running on proprietary or mixed instrumentation. Every gap described above sits there right now as an active risk inside most organizations running distributed systems today.
Alert noise and investigation toil as downstream symptoms of the same gaps
All of this eventually turns into noise. One incident triggers a wave of alerts across multiple tools, each firing on its own, because each tool only sees its own slice of the picture and reacts to whatever partial signal reaches it.
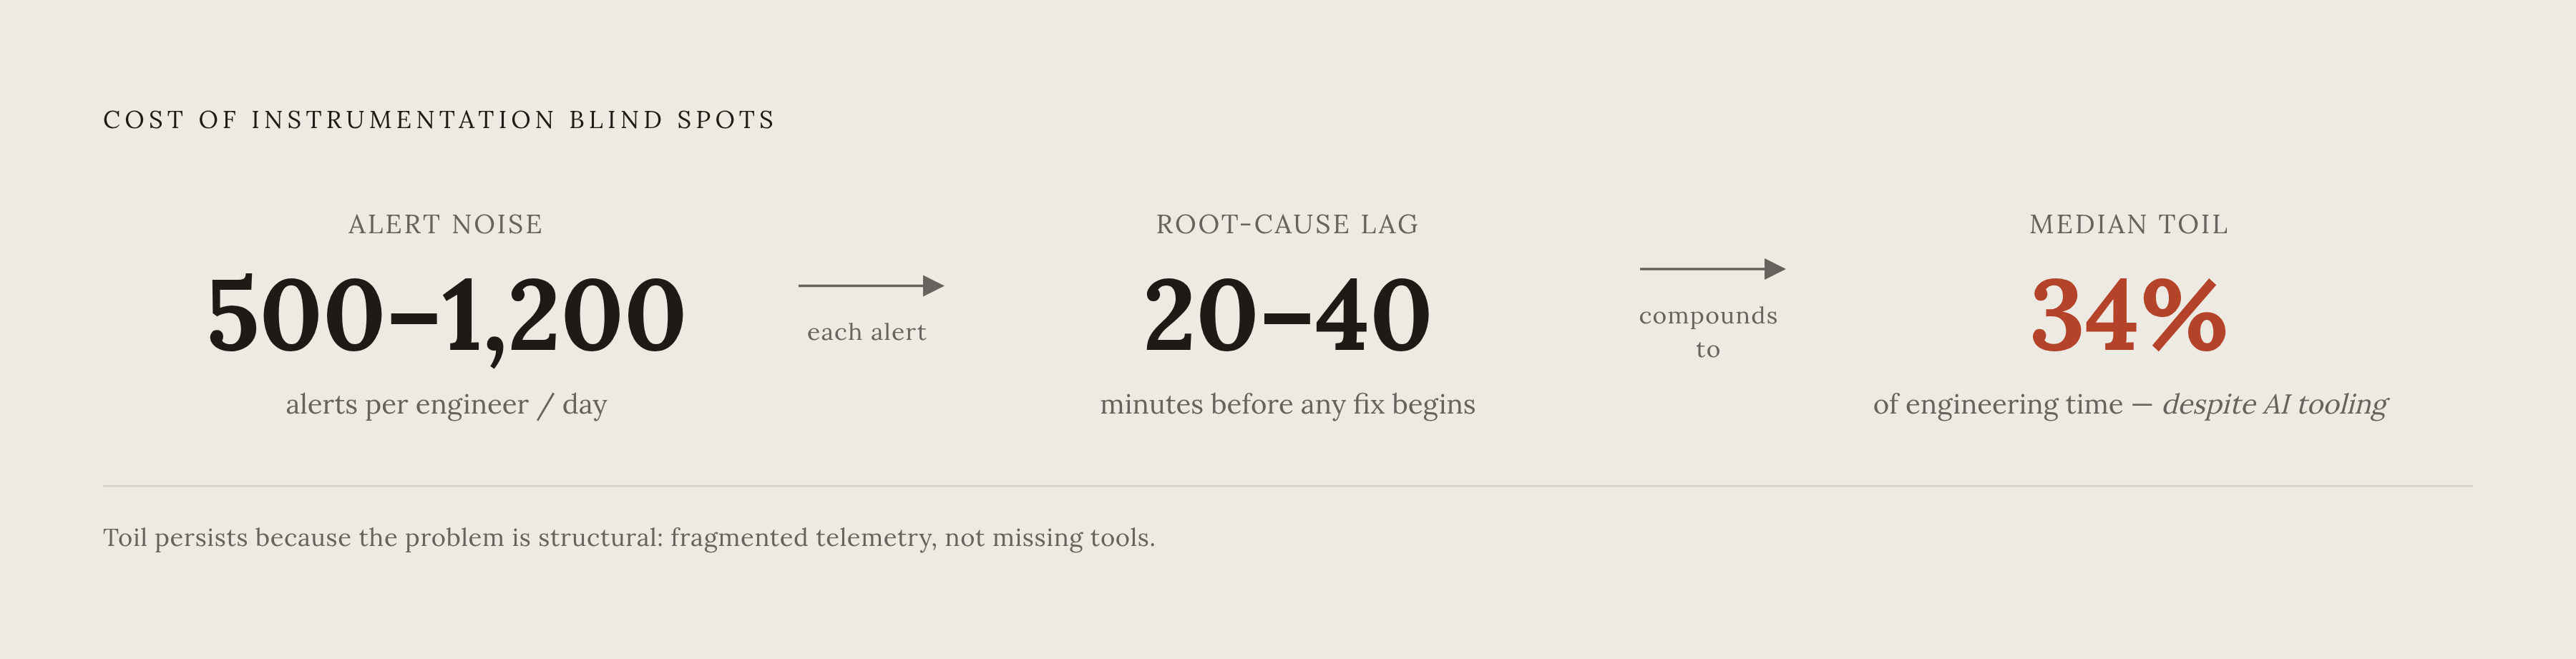
Engineers facing 500 to 1,200 alerts a day start tuning them out, a rational response to an irrational volume of noise. That tuning-out carries a real cost, though: a genuinely critical incident can slip past a team already working inside a system riddled with structural blind spots, because the alert that mattered looks identical to the thousand that didn't.
The cost is measured in time, not just attention. In most teams, engineers spend 20 to 40 minutes just identifying root cause before any fix even starts, and that time gets lost to a workflow that was never built to explain causality across the service boundaries, async layers, and third-party dead zones covered earlier. It's a workflow trying to reconstruct a story from a set of clues that never got fully written down.
None of this is a people problem wearing a technology costume. Median toil still eats up 34% of engineers' time even as AI adoption grows across the industry, which says the gaps in telemetry aren't closing through better tooling alone. They close, on the rare occasions they do close, when teams treat instrumentation as a requirement rather than an assumption, at every boundary this piece has walked through.