Post-Deploy Observability Coverage Audit for Engineering Leaders
Find the observability gaps that will break your incident response before your next deployment.

Green dashboards after a deployment tell you almost nothing about whether the deployment actually worked. A post-deploy coverage audit provides a structured way to find out whether your observability stack can answer real diagnostic questions about production behavior, on a timeline that's actually useful when something breaks. Most engineering organizations discover, usually mid-incident, that the answer is no.
The gap starts with a basic asymmetry. CI validates code correctness under conditions you designed. Production exposes that same code to real traffic volumes, real dependency states, and user behavior nobody scripted into a test suite. Shift-right testing addresses this asymmetry: code running against the actual world produces a long tail of failures that pre-merge rigor never catches, no matter how much rigor is applied. Canary releases get sold as the fix, but a canary without pre-defined promotion and rollback criteria is just a slower deployment. It limits blast radius; it doesn't verify anything, unless someone decided what "good" looks like before traffic started flowing. And monitoring, on its own, only catches the failures you already thought to define. Observability is what lets you go looking for the ones you didn't.
What a post-deploy coverage audit measures
An audit like this measures one thing at its core: whether your observability stack can answer a diagnostic question about a production deployment inside a window that's still operationally useful. Not eventually. Not after someone spends an afternoon grepping logs.
There's a field test that cuts through most of the ambiguity here. Pick a real trace from the past week. Hand a teammate the URL or the timestamp, and ask them to identify which component returned a bad result, and why, in under five minutes. If they can do it, the system is observed. If they can't, everything else in this audit is just the punch list for getting there.
That test breaks down into six coverage axes. Trace coverage asks how much of the system's behavior even produces an inspectable span. Span depth asks what's captured inside that span, the inputs, outputs, timing, retries, failures. Eval signals ask whether quality and correctness data lives attached to the telemetry, rather than off in some separate dashboard nobody checks during an incident. Drift detection asks whether behavioral regressions surface through automated signals before a customer has to report them. Cost and resource attribution asks whether spend is tracked per-user or per-tenant, since aggregate monthly numbers hide the heavy tail that's actually costing you money. And incident-response readiness asks whether a trace can be replayed to reconstruct a failure well enough to find root cause.
This applies to conventional services and agentic workloads alike. Agentic systems just add failure modes that traditional axes were never built to catch, which the later sections get into.
Trace coverage: the first axis that breaks after a deployment
Trace coverage comes first because everything downstream depends on it. Span depth is irrelevant if no span exists. Eval signals can't attach to telemetry that was never captured. Cost attribution and incident replay both assume a trace to attribute or replay. If the trace wasn't emitted, there's nothing else to audit.
Coverage here is binary. Either a component produces a span that can later be inspected, or it doesn't. There's no partial credit mid-incident, and pretending otherwise is how teams end up guessing at root cause instead of finding it.
The breakage after a deployment tends to follow a small set of patterns. Trace context propagation snaps at service boundaries, so the parent span ID quietly stops carrying forward the moment a new service, queue, or tool call enters the request path. Sampling gets left at whatever the library defaults to instead of being set deliberately. The traces you actually need during an incident are exactly the ones that got sampled away. Streamed responses often close their span on the first token instead of waiting for the stream to finish, which corrupts the timing data and leaves it partial. Failed tool calls, retries, and timeouts, the spans with the most diagnostic value in the whole system, go missing because someone only instrumented the success path. And retrieval pipelines (embedding, vector lookup, reranking, document selection) frequently get collapsed into a single span rather than broken into discrete children, so if the failure is inside retrieval, there's no way to see where.
Three operational states tend to show up in audits, and it's important to be honest about which one describes your system. Blind means unstructured logs, request IDs that don't survive a service boundary, and prompt or response bodies stripped before anyone could use them, root cause becomes folklore passed between engineers rather than something derived from data. Hybrid, or transitional, means sampled traces somewhere in the 1 to 10 percent range, logs filling in the rest, and evals living on a disconnected surface: useful, until an incident is in the unsampled majority, which it eventually will. Observed means every turn produces a parent span with proper children, model invocation and retrieval broken out separately, and a full run that can be replayed end to end.
Signal depth and span data loss
Trace coverage tells you a span exists. Span depth tells you whether that span is worth anything once someone's staring at it during an incident, under pressure, with a clock running.
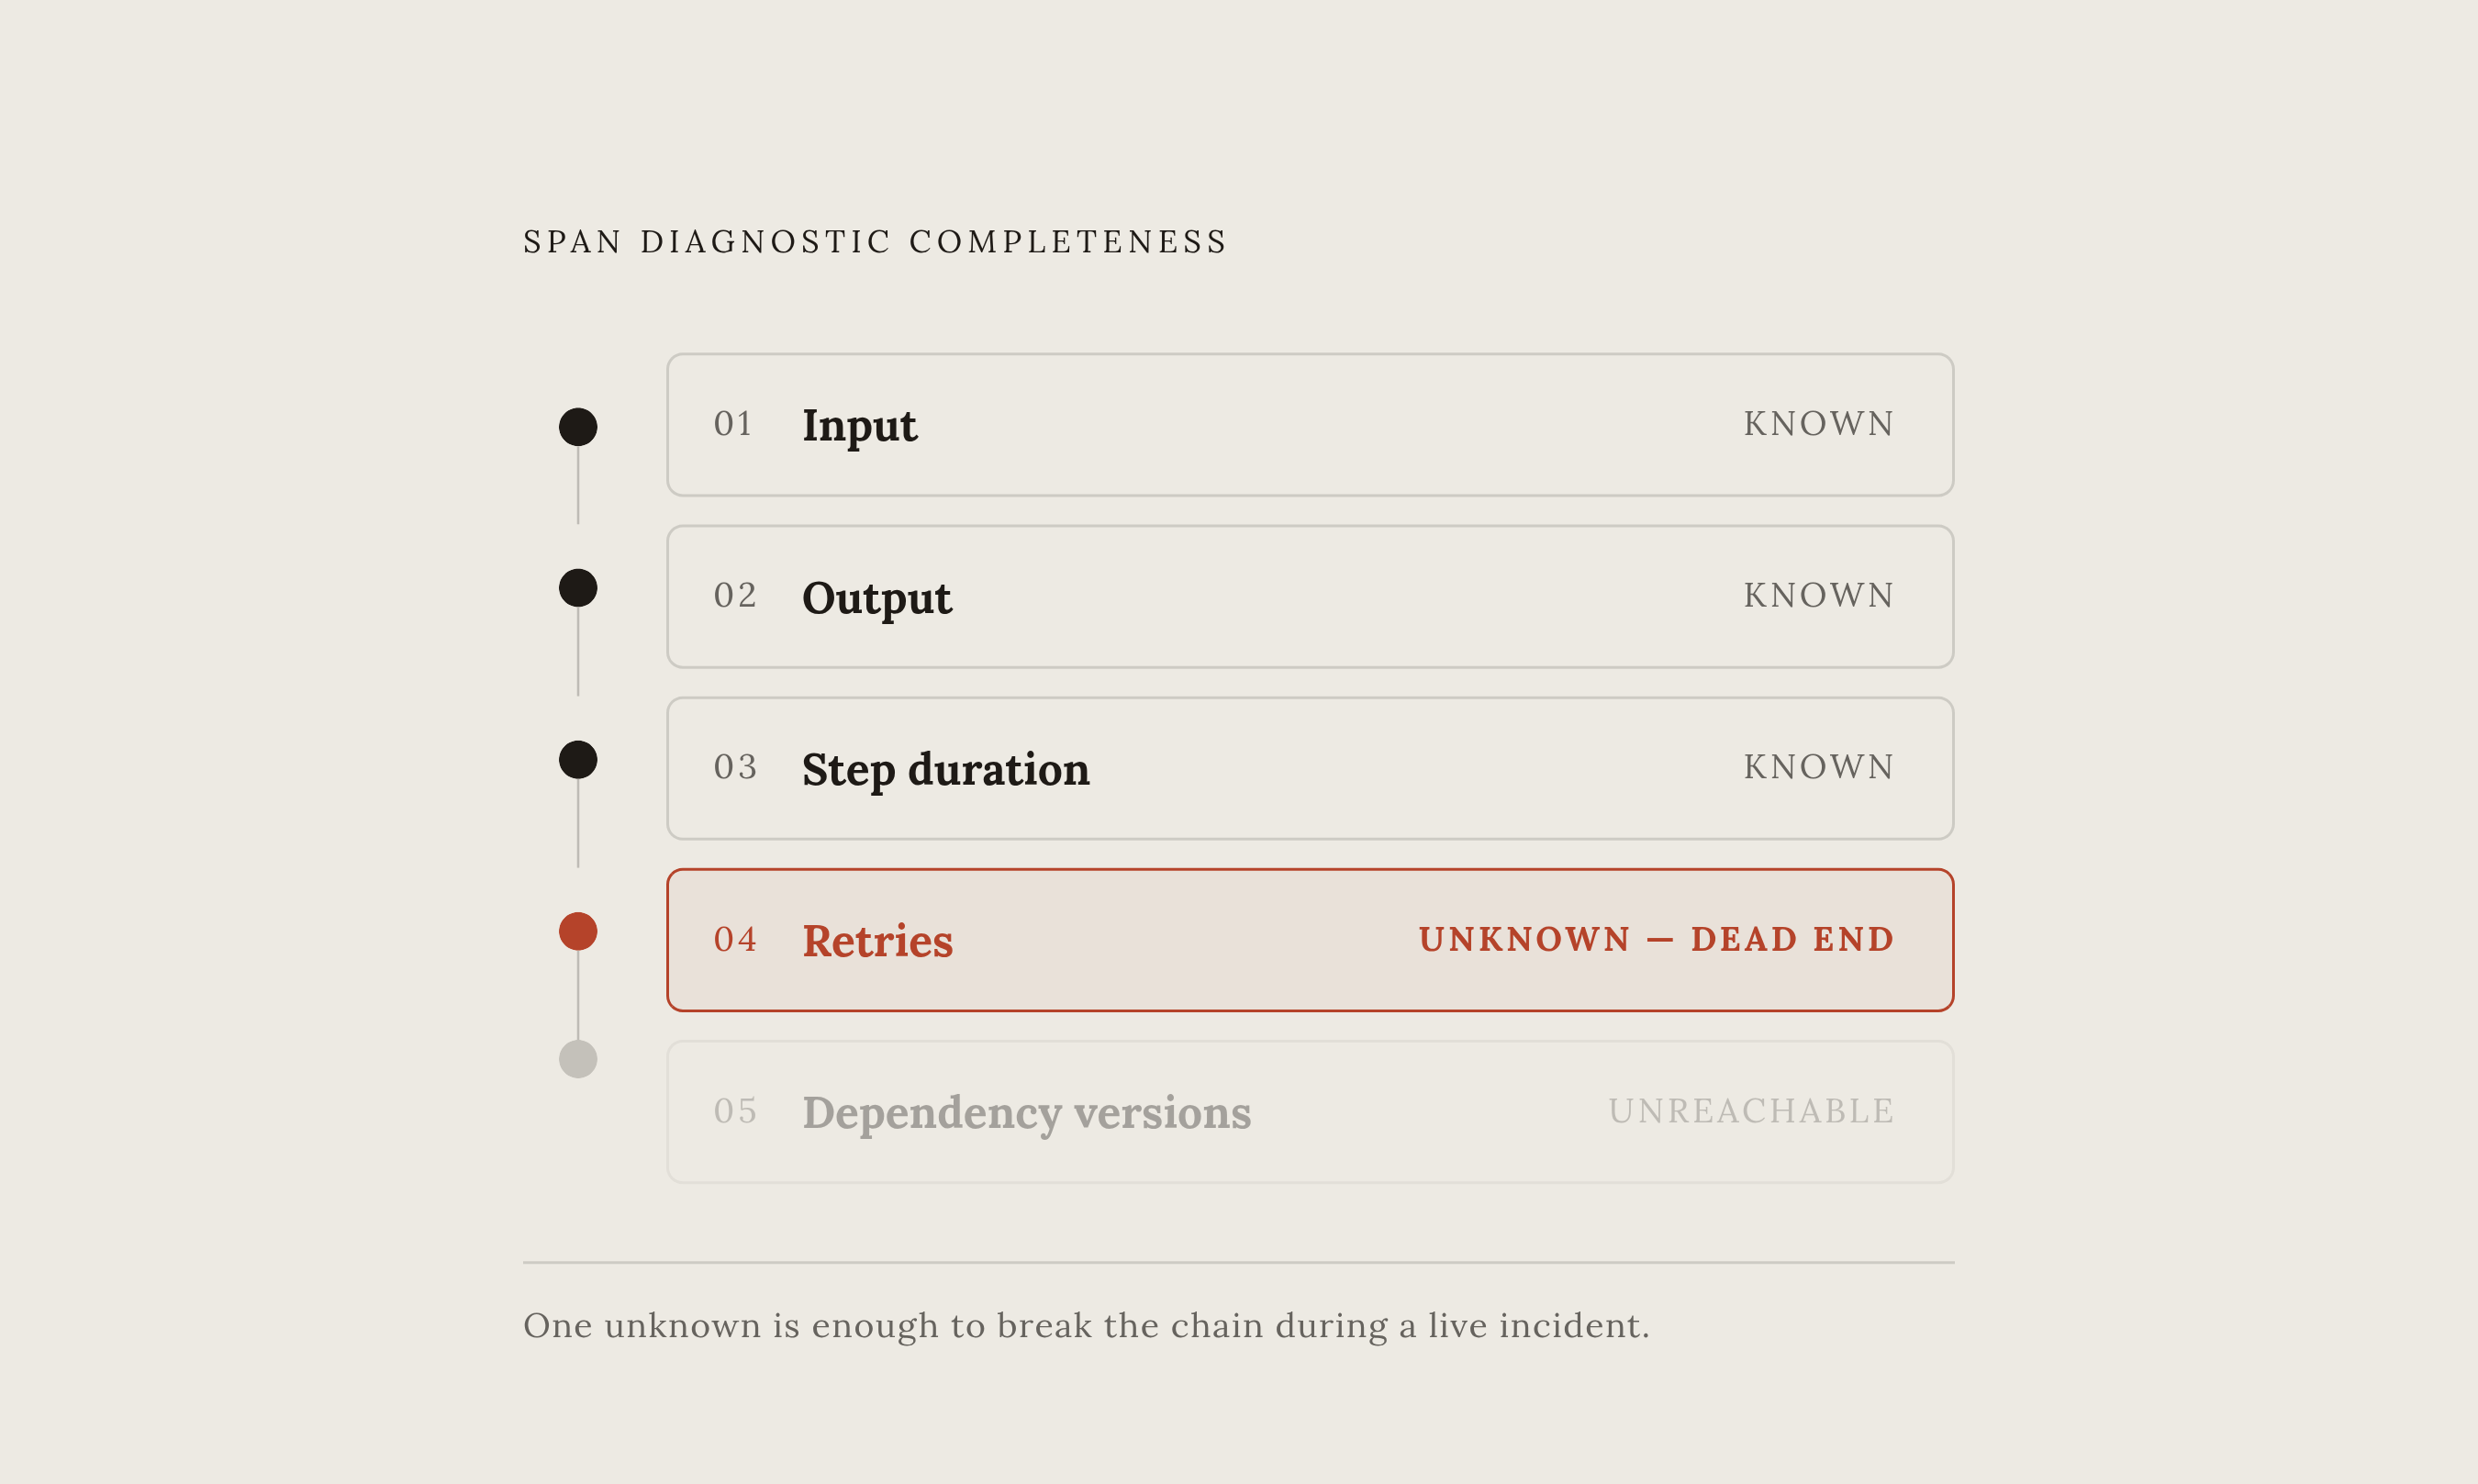
Depth means the input and output payloads are actually preserved, not just a status code, with PII redaction happening at the collector rather than by stripping the field outright and losing the diagnostic value along with it. Timing is captured per operation, so a slow step is visible without inference. It means retry counts and retry reasons are recorded as their own field, since a response that succeeded after three retries looks identical to a clean first attempt without that data point, and those are two very different production stories. It means errors are classified by type and upstream source, not flagged with a bare boolean. And it means the span records what dependency version and configuration were live at the moment of the call, because a span with no context about what it hit becomes unreadable the instant a deployment changes something underneath it.
Smoke tests run after deployment should complete quickly, inside a short observation window, and that timing constraint is a proxy for depth. If engineers can't confirm core functionality is intact within that window, the instrumentation isn't supporting a fast promotion or rollback decision, it's just adding a delay before the decision gets made anyway, with less information than it should have.
The audit action is mechanical: for every span that's captured, check whether it can answer five questions. What was the input. What was the output. How long did each step take. Did anything retry. What version of each dependency was involved. Any "unknown" in that list is a depth gap that needs fixing before it becomes a dead end during the next incident.
Alert coverage breakdown: noise as a coverage failure
More alerts is not the same as more coverage, and treating volume as a proxy for thoroughness is how teams end up drowning in signal while missing the one that mattered. Roughly 80% of organizations say half or fewer of their alerts are actually actionable, and 77% of on-call teams field at least ten alerts. That's not a tuning problem at the margins; it's a system that's mostly generating noise and calling it monitoring.
The cost of that noise isn't abstract. A Splunk survey (n=1,855) found 73% of organizations had outages tied to alerts that were ignored or suppressed. Signal noise isn't an inconvenience engineers learn to live with, it's a direct, measurable path to missed incidents.
The gaps that open up right after a deployment tend to follow a pattern. Threshold-based alerts stay calibrated against pre-deployment baselines, so a deployment that shifts traffic patterns makes the old thresholds wrong the moment it ships. Alerts fire on symptoms instead of causes, so a downstream latency alert with no upstream correlation sends engineers diagnosing from exactly the wrong end of the system. SLO-aligned burn-rate alerts are often missing entirely, which means teams watching raw error rate miss the slow erosion that never crosses an absolute threshold but still eats the SLO. And known-noisy signals go unsuppressed, so a single root cause cascades into a page storm that buries the one alert an engineer actually needed to see.
The remediation sequence that holds up: deduplicate first, then group and correlate related alerts, then add dependency-aware suppression, then move to SLO-aligned thresholds, and only then fix the instrumentation at the source. Downstream filtering buys fast relief, but it drifts back into noise over time. Fixing the source is slower, and it's the only fix that actually lasts.
A structurally different class of coverage gap in agentic workloads
Agents fail while looking like they succeeded. The output is well-formed, the run completes, the dashboard stays green, and the agent called the wrong tool, retrieved the wrong document, or reasoned its way to a confident, wrong answer. None of that registers as a 5xx anywhere in the stack, so traditional monitoring misses it.
Traditional APM was built to track deterministic HTTP paths and status codes across stateless request flows. It has no vocabulary for a reasoning step or a semantic failure. An agent that loops on a malformed sub-query, retries seven times, and still returns the wrong answer will show up perfectly healthy in a latency histogram, because latency was never the problem. If parent span IDs don't propagate across agent boundaries, the handoff itself becomes invisible, and whatever went wrong during it stays that way, so inter-agent handoffs compound this problem.
Agentic observability has to treat prompts, external API calls, tool selections and their outcomes, intermediate reasoning steps, and inter-agent handoffs as first-class telemetry, structured, queryable spans in their own right, not metadata bolted onto an HTTP span as an afterthought.
The scale of the exposure matters. Roughly 88% of organizations are using AI somewhere, and most are experimenting with agents, but fewer than 10% have scaled agentic AI to full production. The gap between a pilot and a production deployment is, more often than not, the ability to actually see what the agent did.
Drift detection: the coverage gap that only shows up after the deployment settles
Drift is silent regression: a shift in retry rate, cost-per-turn, eval score distribution, tool-selection frequency, or error class distribution that stays under every alert threshold while still degrading the service, one increment at a time. This failure never trips a page, and by the time it's visible in a dashboard, it's usually visible to customers first.
Standard coverage misses drift by design, not by accident. Smoke tests and synthetic monitors check behavior at a single moment, and they pass, because at that moment nothing was wrong. Drift is a trend across time, and catching it requires a rolling window.
In a LangFuse rollout case study, hourly rolling-window monitoring across retry rate, cost-per-turn, eval score, and tool-selection distribution caught two prompt regressions and one tool-schema breakage over a 90-day engagement, each within hours of onset. Before that monitoring existed, the equivalent regressions went undetected until they had already run their course. That's the actual cost of skipping this axis: issues compound silently rather than surfacing through instrumentation.
The audit here has a few concrete checks. Confirm drift detection runs over a rolling window rather than a fixed-threshold snapshot. Confirm at least four signals are covered: error and retry rate, latency distribution, cost per operation, and some quality or eval signal. For agentic workloads specifically, confirm tool-selection distribution is being watched, because a model that starts favoring a different tool than the one it was evaluated on has drifted, even if latency and error rate haven't moved an inch. And confirm every drift alert has a named owner and a remediation runbook attached to it, so it doesn't sit as a notification dropped into a Slack channel where it'll sit unread.
Incident-response readiness as a coverage dimension most audits skip
Having traces is not the same as being able to use them while an incident is live. Incident-response readiness audits whether the observability stack supports diagnosis from alert to root cause, without forcing engineers to jump across four different tools while the SLO clock keeps running.
That tool-sprawl tax is real and it's large. Roughly 83% of organizations juggle four or more tools during a live incident, and every one of those context switches is time spent not fixing the problem. That's the argument for consolidation, and it's the argument most post-deploy audits skip entirely, focusing on whether data exists rather than whether it's usable at the moment someone actually needs it.
The sources checked for this guide are listed below.