Reliability Metrics for Engineering Quarterly Business Reviews
Connect reliability improvements to business outcomes, not just uptime scores.

Most of that data never reaches the room where it would matter, sitting in dashboards that only engineers read. It sits in dashboards that only engineers read, disconnected from the decisions those numbers should shape. Catchpoint's 2026 SRE Report found that only 26% of teams consistently measure whether reliability improvements affect business metrics like revenue, so even when engineers improve systems, that improvement often never registers as a business outcome. The failure that follows in the quarterly business review is specific and repeats itself: reliability gets presented as an uptime scorecard, executives file it as a routine hygiene update, and it leaves the room without touching headcount decisions, roadmap priority, or the company's appetite for risk. Engineering leaders tend to describe this as a measurement problem, but the metrics generally exist. What's missing is the discipline of choosing which signals carry business weight and building the case around them so they speak the language of investment and risk rather than the language of operations. That translation gap is the subject of this piece.
Why AI-assisted development has made the translation problem urgent
AI-assisted development tools have made engineering teams faster at shipping code, and that speed has come with a quiet cost to stability that most QBRs are not built to catch. A QBR that reports only deployment frequency or cycle time, without a matching measure of what that speed is costing in production, risks giving executives a story that sounds better than the underlying reality. Faros AI's 2026 telemetry, drawn from a large population of developers, found that incidents per pull request have risen sharply, to the point that the odds of a production incident following any given code change have more than tripled compared to the prior dataset. Larger pull requests merged on a faster cadence, without a matching increase in review discipline or test coverage, produce that rise in incidents per pull request, and deployment frequency climbs while change failure rate climbs right alongside it. That pairing breaks a piece of conventional wisdom that DORA metrics have relied on for years: a rising deployment frequency used to be read as a sign of process maturity, and now, on its own, it can just as easily be an early signal of a quality trade-off that hasn't yet turned into a visible incident. The practical consequence for a QBR is uncomfortable. A team standing in front of executives with an improved deployment frequency number is not necessarily lying, but it may be telling a story that is accurate in its details and wrong in its implication.
What "production reality" means as a data source
Passing tests in a CI pipeline and clean results in staging tell you a deployment cleared its preconditions. They do not tell you it succeeded. The only real confirmation that a release works comes from what happens once it meets live traffic, real users, and the unpredictable conditions of production, and that is a category of evidence no pre-merge test can substitute for. Post-deployment verification breaks into a few concrete practices: release verification, which checks that core features, APIs, and services are functioning correctly under actual usage; performance monitoring, which tracks latency, throughput, and error rates as they occur; and observability work such as distributed tracing and log analysis, which reconstructs what happened when something goes wrong. A basic habit that separates teams with usable telemetry from teams without it is annotating deployments directly on dashboards, so that when an error spike appears, the deploy responsible for it is immediately visible rather than something to reconstruct hours later.
Gearset's presentation at QCon London 2026, given by Julian Wreford and Oli Lane, illustrated what this looks like when done well. The team moved from monitoring queue size to latency-based alerting, using OpenTelemetry trace state to track how long asynchronous operations actually took. That shift improved incident response and exposed architectural waste that queue-size monitoring had been hiding for years. Production signals carry different weight depending on what question they answer: automated smoke tests catch a bad deployment within minutes, distributed tracing attributes a latency change to the specific service causing it, and error budget burn rate turns aggregate performance data into a forward-looking measure of risk. Each of those signals matters for a different audience and a different decision, which is the premise the next section builds on.
The metrics that translate into QBR language
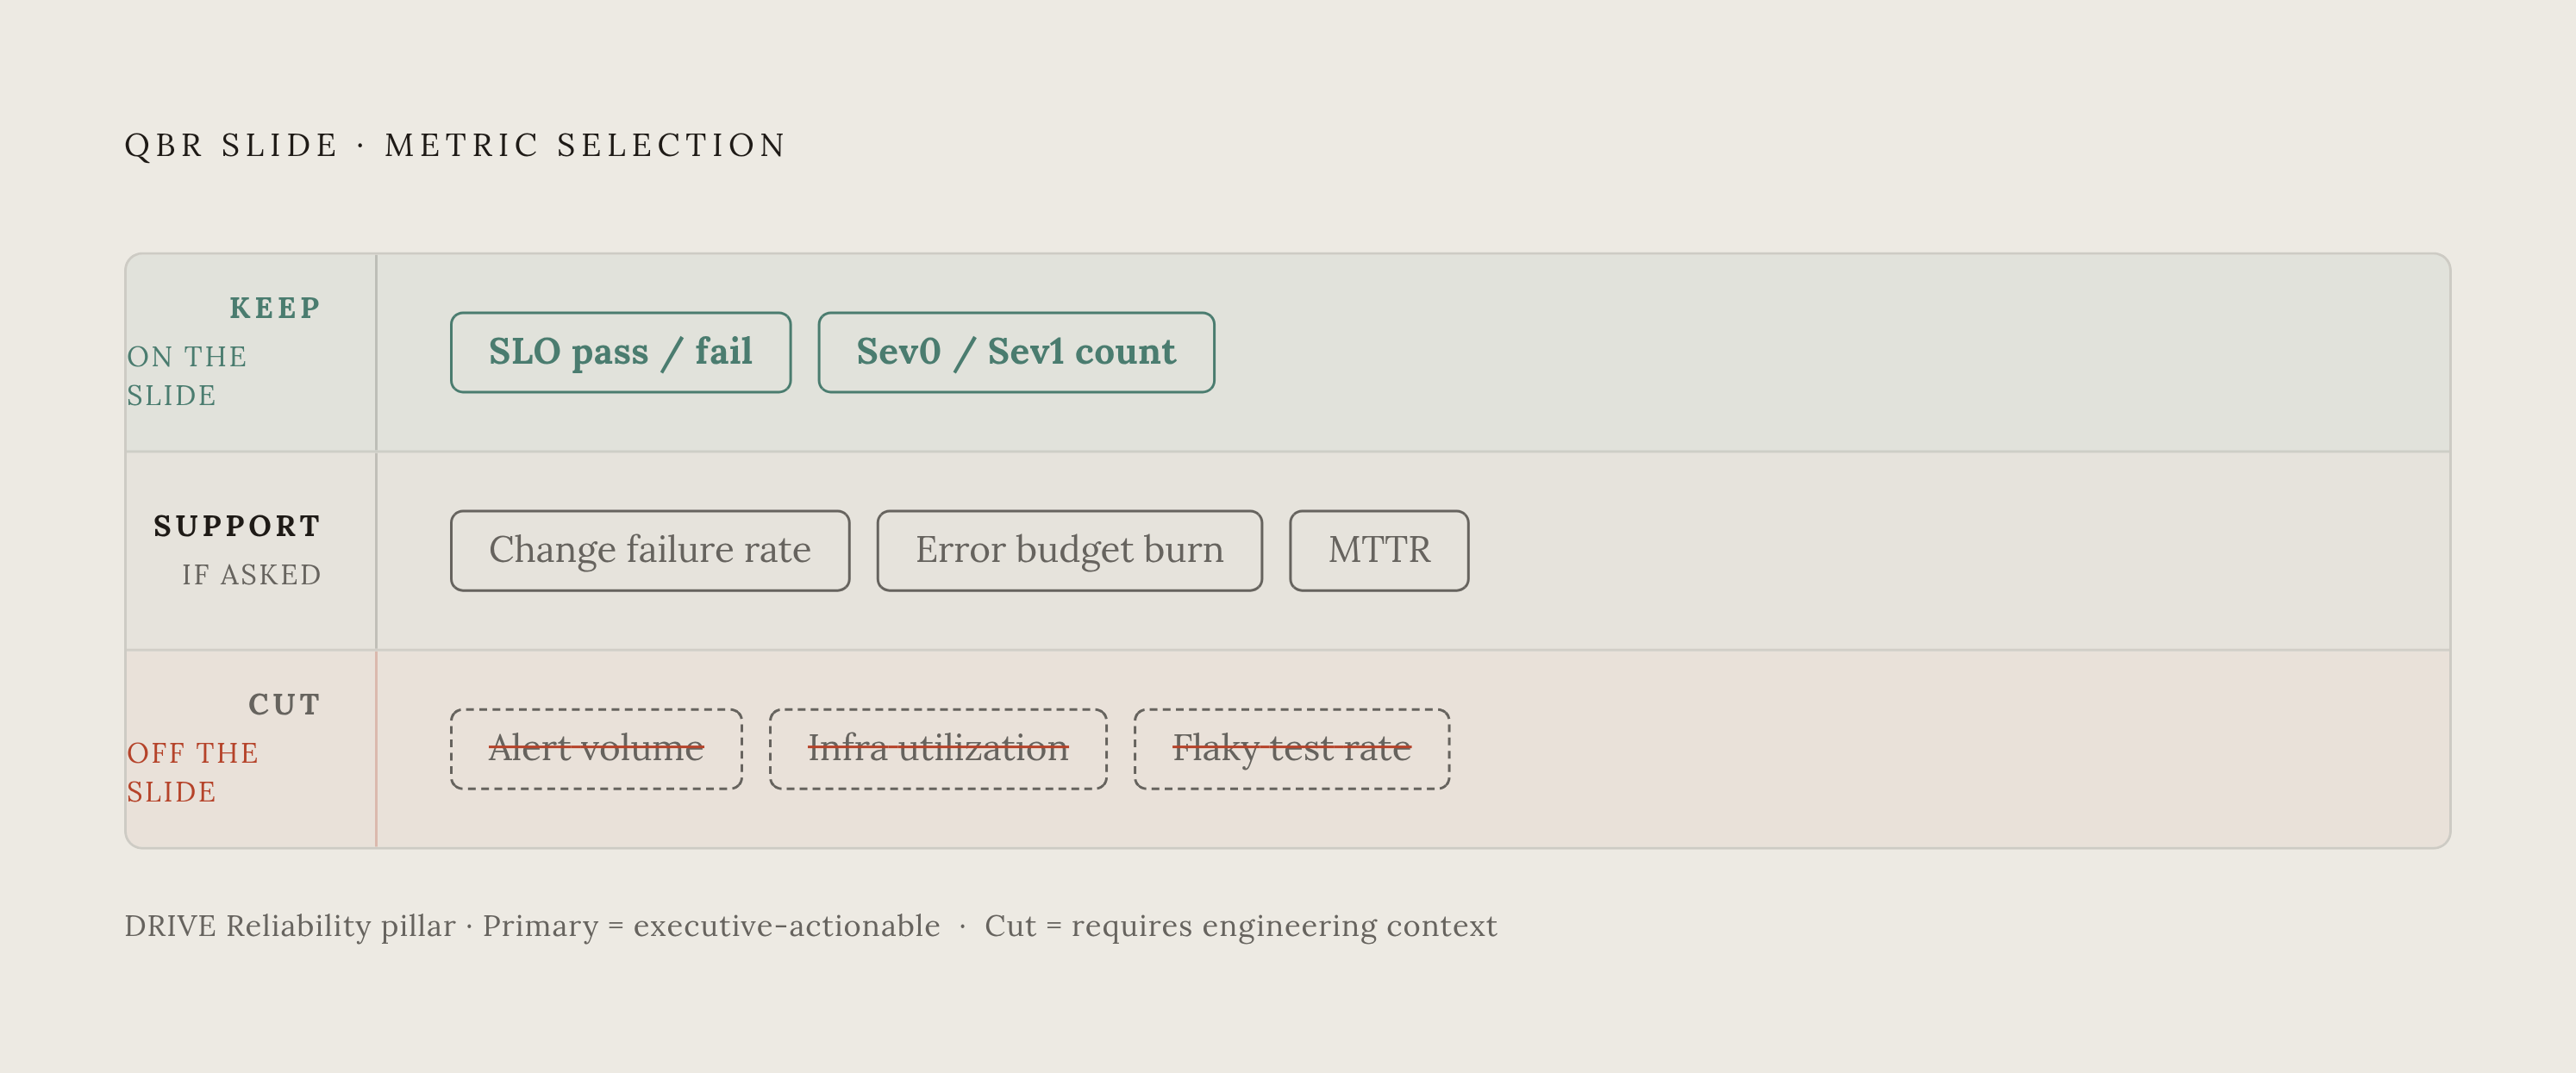
The metrics that hold up in a QBR are the ones tied to customer experience and business risk rather than internal operational load, and that standard eliminates most of what engineers instinctively reach for when asked to report on reliability. Cortex's 2026 engineering metrics guide, built around its DRIVE framework covering Delivery, Reliability, Initiatives, Vigilance, and Efficiency, identifies two metrics as the core of the Reliability pillar. The first is a curated list of functional service-level objectives measured as pass or fail, not raw SLO percentages but a binary read on whether the team is meeting the commitments it made to users, which maps directly onto the question executives actually care about: are the promises being kept. The second is Sev0/Sev1 incident count, a straightforward tally of the most severe production incidents in a given period, a number executives already understand as a measure of business risk without any translation required.
Beyond those two, a small set of supporting metrics earns its place in a QBR deck. Change failure rate is the DORA metric that most directly exposes the tension between speed and stability. When it rises at the same time deployment frequency rises, that combination describes an unsustainable pace in a way that deployment frequency alone conceals. Error budget burn rate converts SLO performance into a forward-looking constraint: rather than reporting an availability percentage for the quarter that already happened, it tells executives how much risk capacity remains for what comes next, for instance if a team has already burned a large share of its quarterly budget in the first month, that limits how much additional risk it can safely absorb before the quarter ends. MTTR, now formally renamed Failed Deployment Recovery Time under the current DORA model, answers a question executives ask instinctively: when something breaks, how much of the business's time does it consume before service is restored.
Just as important is what belongs off the slide. Mean alert volume, raw infrastructure utilization, and flaky test rates are all useful for engineers diagnosing a system day to day, but they demand too much context to mean anything to a business audience without a lengthy explanation that a QBR has no time for.
Framing reliability metrics as investment and risk signals
The same number can land completely differently depending on how it's framed. Presented as a scorecard, a metric gets acknowledged and filed away. Presented as a claim about risk or investment, it shapes what happens in the next quarter. SLO pass/fail status is a clear example. The 2026 SRE Report found near-consensus among reliability professionals that performance degradation is treated as seriously as outright downtime. Users already experience slowness as a reliability failure, and SLO breaches should be framed to executives in those terms rather than as a narrower technical miss.
Change failure rate and incident count work the same way when framed as a velocity tax rather than a velocity win. When an AI-assisted team's deployment frequency rises alongside a rising change failure rate, the honest version of that story for a QBR names the tradeoff" It's closer to: shipping more, under the team's current process discipline, produced a specific number of incidents this quarter, and those incidents consumed a specific number of engineering hours in recovery. Error budget burn rate becomes a risk budget for roadmap decisions under the same logic. If the budget is already partly consumed, the team has less room to take on a risky migration or a new feature launch before SLOs start breaking, and that is a statement about capacity for the next quarter's planning conversation, not a report on the last one.
The WGU case shows what this looks like in practice: using the AWS DevOps Agent, the SRE team cut resolution time on a service disruption from an estimated two hours down to 28 minutes. Reported as "we improved MTTR," that result reads as a technical footnote. Reported as "an incident that used to cost two hours of a senior engineer's time now costs 28 minutes," it becomes a statement about the economics of on-call staffing, one that changes how many engineers a company needs on rotation and what that rotation costs.
Alert noise deserves the same treatment. NeuBird AI's 2026 State of Production Reliability report found that 80% of organizations say half or fewer of their alerts are actionable. What matters in a QBR is not alert volume but the engineering capacity those false positives are consuming, capacity that could otherwise go toward product work.
The alert noise problem as a QBR conversation about toil and capacity
Alert fatigue tends to get filed as an engineering operations detail, something for the on-call rotation to sort out on its own. It functions instead as a capacity and retention risk, and it belongs in the same QBR conversation as headcount and team health. NeuBird's 2026 report found that a large majority of organizations report half or fewer of their alerts as actionable, while most on-call teams field a high volume of alerts every day. The capacity lost to triaging that noise is measurable, and it's recoverable.
The mechanism generating most of that noise is well understood. Static-threshold monitoring treats ordinary variation in traffic the same way it treats an actual failure, firing alerts for both. Moving alert logic to SLO and error-budget-based detection removes a large share of those false positives, because a page only fires when there's measurable user impact rather than a number crossing an arbitrary line. Teams that run a structured audit of their alerts typically find that most of them fall into categories that add no value: auto-resolved, duplicate, or purely informational. That's the noise that can be cut without losing anything real.
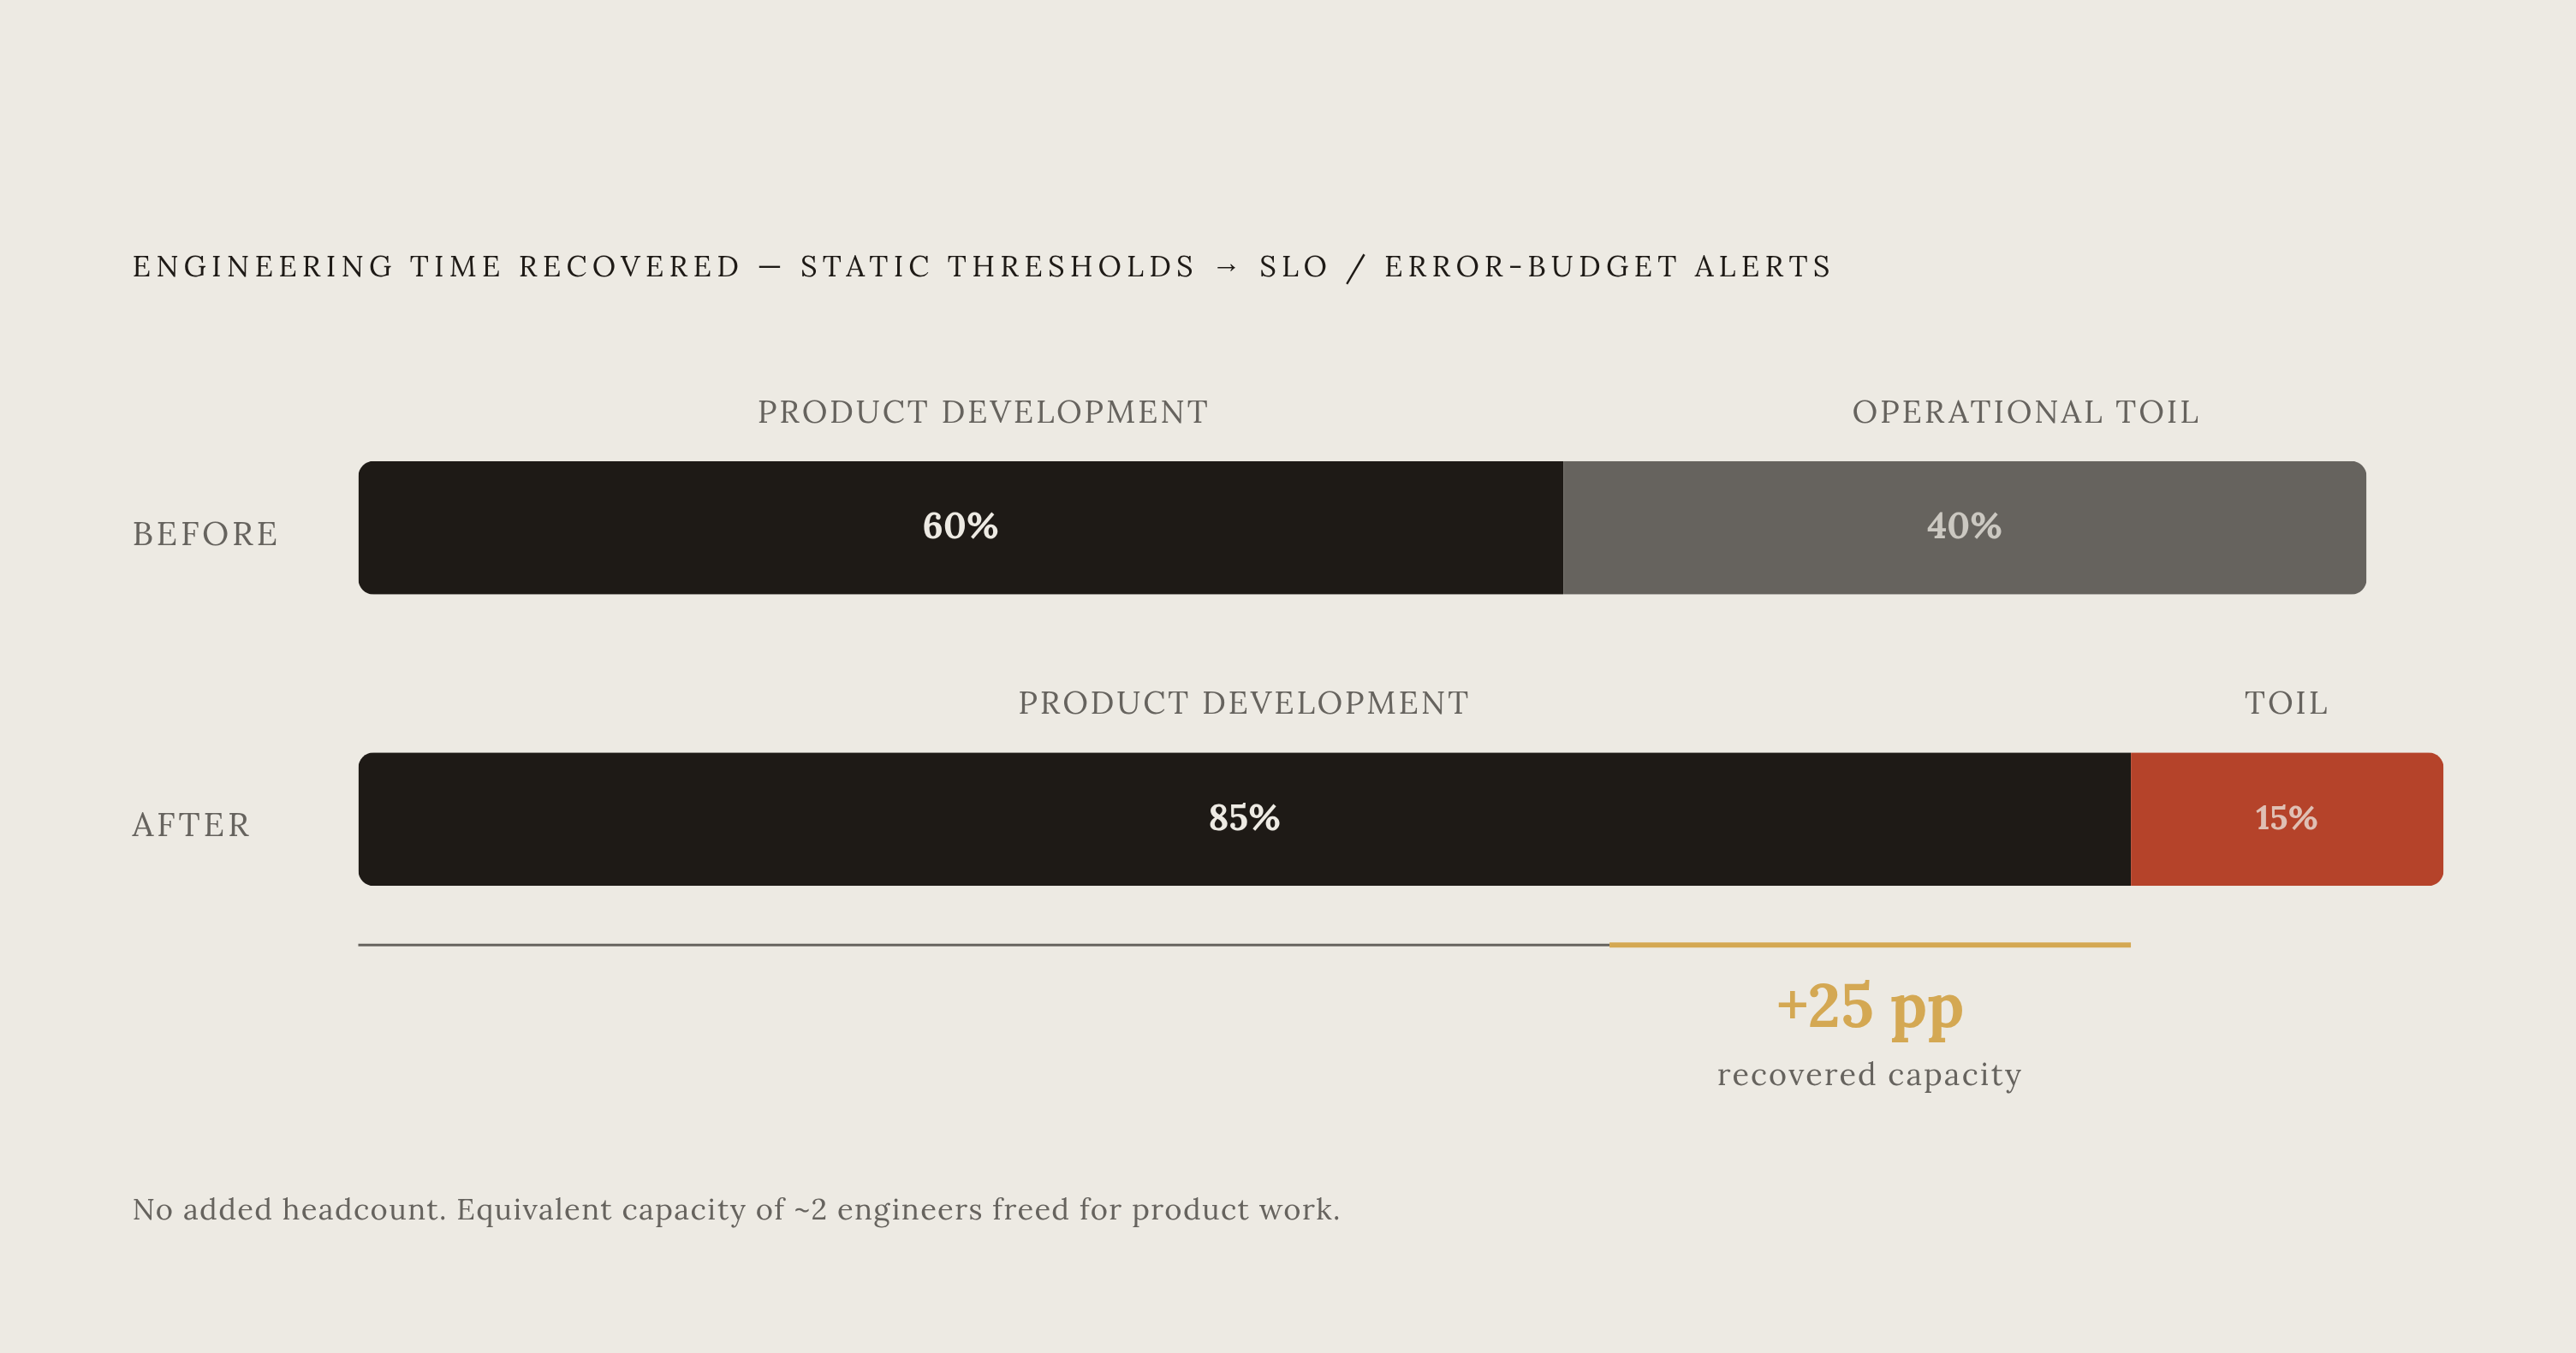
The QBR version of this argument works best in terms of recovered capacity. One team reported moving from roughly a 60/40 split between product development and operational toil to something closer to 85/15 after addressing its alert noise. Framed in a QBR, that shift reads as recovering the equivalent of several engineers' worth of productive time without adding a single headcount, which is a genuinely compelling investment case. Tool sprawl makes the underlying problem worse: every additional monitoring tool an engineer has to check mid-incident is time the SLO clock keeps running. Consolidating those signal sources is a reliability intervention in its own right, beyond the line-item cost saving.
Where automated production verification changes what QBRs can report
Closing the gap between what CI confidence promises and what production actually delivers requires verification after every single deploy. Post-deploy automated smoke tests run lightweight checks confirming core functionality is intact, a fast, inexpensive way to catch a bad deployment before it turns into an incident whose cost appears in the next QBR.
AI-generated code raises the stakes on this discipline. Agents responsible for producing code should face evaluation before every deploy and continuously afterward: offline evaluations run against fixed datasets catch regressions before they ship, and online evaluations sampling live traffic catch the real-world issues that synthetic test data misses entirely. That two-layer approach is the same discipline production verification already applies to conventional deployments, extended to cover a new source of change.
MTTR improvements have leveled off industry-wide for a specific reason: detection got faster, but resolution didn't keep pace. Distributed tracing helps teams find an incident quickly, but everything that happens after detection still depends on a person reading context across logs, traces, deploy history, runbooks, and old postmortems by hand. Automated verification closes the detection half of that gap. Autonomous fix PRs are starting to close the resolution half.
The QBR stakes here are direct. A team running automated verification has metrics it can actually trust: change failure rate reflects failures caught as they happen rather than incidents discovered weeks later, and MTTR reflects real recovery time rather than time spent noticing a problem and switching context to address it. Executives making investment decisions on numbers that don't hold up under that scrutiny are making decisions on bad information, whatever the dashboard shows. OnePatch verifies every pull request against live production telemetry after it deploys, catches regressions before an engineer gets paged, and opens fix pull requests on its own. The metrics it produces for a QBR are grounded in continuous production verification rather than a retrospective count of incidents assembled after the fact.
Building a QBR reliability section that executives will act on
A reliability section earns executive attention when it presents three things in sequence: the current state of the customer experience promise through SLOs, the cost the business paid for failures over the past quarter through incidents and their recovery burden, and the forward-looking risk picture through error budget and the ratio between velocity and stability. Structure the reliability slide around the DRIVE framework's Reliability pillar: SLOs as pass/fail and Sev0/Sev1 incident count as primary metrics, with MTTR, change failure rate, and error budget burn rate as supporting evidence, sequenced to build toward a conclusion rather than dumped on a single slide all at once.
Goodhart's Law applies directly here: once a measure becomes a target, it stops functioning as a reliable measure. The metrics that belong in front of executives are the ones that expose a tradeoff. A rising deployment frequency shown next to a rising change failure rate tells a more honest and more useful story than either number would on its own.
The executive ask at the end of the section should follow directly from the metrics that came before it. If alert noise is consuming a meaningful share of on-call engineers' time, the ask is headcount reallocation or investment in better tooling." If the error budget is burning faster than the quarter can sustain, the ask is a decision about release pace for the quarter ahead. Reliability metrics that reach a QBR in this form stop functioning as a status update and start functioning as a proposal, one built on production evidence rather than a dashboard nobody outside engineering ever opens.