ROI Measurement for Incident Response Automation Investments
Measure incident response automation ROI using four operational metrics, not probability models.

To measure ROI on incident response automation, you track four operational metrics, not a probability-weighted dollar figure projected from the executive floor. The four that hold up are MTTR reduction, alert consolidation ratios, engineer toil cost, and incident cost avoidance, and each comes from a system a team already runs, with a baseline it can pull today and a post-deployment number it can compare against in 90 days.
Why standard ROI projections fail to justify automation spend
Cybersecurity ROI, often shortened to ROSI, measures risk reduction and cost avoidance. That single fact is the source of most of the trouble. Revenue is observed; risk reduction has to be modeled, and modeling it means assigning a probability to a breach or an outage that didn't happen, then attaching a dollar figure to an event nobody can point to. CFOs push back on that kind of number because it can't be audited against anything concrete, and engineers push back on it because it describes nothing they recognize from their own shift logs.
The cost side of the equation doesn't hold still either. The threat environment adds another layer of drift: a model has to be updated continuously because the thing it's supposed to prove, the breach that didn't happen, can't be directly observed, only estimated after the fact.
The outcome of all this is a credibility gap between the boardroom and the floor. The fix is to stop projecting and start anchoring: measure specific operational metrics before and after deployment, the same way a team would measure any other infrastructure change.
What operational metrics move when automation is working
Four metrics give a team numbers that survive scrutiny because they come out of systems already in production: MTTR reduction, alert consolidation ratios, engineer toil cost, and incident cost avoidance. Each one has a natural baseline, the pre-automation state, and each can be stated in language an engineering lead and a finance lead both evaluate, with no probability model standing between them.
These four work where probability modeling doesn't because they're observable, not estimated. MTTR comes straight out of ticketing data. Alert consolidation ratio comes out of the monitoring stack. Toil cost comes out of on-call hours and a payroll figure. Cost avoidance is the one exception that still requires some estimation, but even there the estimate gets anchored to incidents that actually happened.
The four metrics also split naturally into two tiers. MTTR and alert consolidation are leading indicators: they move within days of deployment and tell a team whether the automation is doing its job at the point of contact. Toil cost and incident cost avoidance are lagging indicators that take a quarter or more to compound into a number worth reporting. A complete ROI case needs both tiers, because a leading indicator without a lagging one is a promise, and a lagging indicator without a leading one is a number nobody can explain.
MTTR reduction: establishing a baseline and reading the benchmark range
Mean time to resolve is the most defensible single metric in this framework because it has a clean baseline, a clean post-deployment value, and a documented range of improvement across real production deployments. Western Governors University, running on AWS, saw total resolution time fall from roughly two hours to 28 minutes after deploying an agentic AI incident response pipeline, a 77% improvement that shows what the upper end of this range looks like in a live environment.
The pattern across independent studies is consistent: automation is the most reliable driver of measurable security ROI, and faster response with lower MTTR is the mechanism behind it. A team without an instrumented incident timeline has no way to calculate this improvement, which makes the first operational step obvious: pull ticketing data for the last 90 days and compute median and 95th-percentile resolution times by incident category. Without that baseline, a post-deployment number has nothing to be compared against.
A result like the one at Western Governors University may be an outlier, not a typical outcome, and that objection deserves to be taken seriously. The response to that objection is to treat the finding across independent studies as a range. Teams should model conservatively against the lower end of that range and treat anything closer to the upper end as upside, not as the planning assumption.
MTTR also isn't one number so much as five phases stacked together: detection, triage, routing, diagnosis, and resolution. Each phase carries its own automation leverage, so if a team automates triage but leaves diagnosis manual, it will see only partial improvement in the aggregate figure. The most credible baseline comes from teams that instrument every one of those phases separately, because isolating where automation delivers the highest leverage tells a team where to invest next. Systems designed to catch post-deploy regressions automatically, rather than waiting for a human to triage an alert, compress the detection-to-diagnosis window most dramatically. That's part of why MTTR gains cluster most visibly in organizations that shift verification toward production telemetry alongside pre-merge gates.
Alert consolidation ratios: measuring the signal that drives everything else
An MTTR improvement holds up only if the alert consolidation ratio upstream of it also improves; otherwise it fades.
The mechanics are concrete. If that compression doesn't happen, any MTTR gain erodes as volume grows, because an engineer's response time per alert can improve even as the total number of alerts keeps climbing.
Cambia Health Solutions offers a documented case where consolidation and MTTR improvement moved together. Mean time to resolve, which had been running at 30 minutes against a committed 15-minute SLA, twice the target, improved to the point where critical alerts could be identified within 30 seconds, and NOC-wide SLA compliance reached 95%. So fewer things for an engineer to manually sort through link directly to a faster response to the ones that matter.
Alert noise and tool sprawl compound each other, and the consolidation ratio captures both at once. The counter-finding that teams need to sit with is that buying AI tooling on top of a noisy alert stack doesn't make the noise go away. A team that skips alert hygiene and layers automation on top may see its consolidation ratio improve modestly, but it won't get the step-change that makes an ROI case legible to finance.
Engineer toil cost: converting on-call hours into a number finance can use
Engineer toil cost is the metric most likely to get a CFO's attention, because it converts an operational improvement into fully-loaded labor cost that already lives on an existing budget line. The calculation itself is straightforward: hours per on-call rotation spent on repetitive incident tasks, multiplied by the number of engineers on rotation, multiplied by fully-loaded hourly cost, multiplied by rotations per year, gives an annual toil figure that automation can plausibly address.
Walmart's AIDR system shows a documented ceiling, not a typical outcome. A figure like that belongs in a team's planning as the upper bound to work toward, not the number to put in a first-year budget projection.
Engineer turnover driven by on-call burnout is a cost that almost never appears in a toil projection. Automation converts analyst hours spent on repetitive work into a number that can be recovered on paper, but only if a team actually measures the baseline hours before deployment starts. When systems run verification checks continuously against production telemetry, they can automate that investigation entirely, turning what used to be manual diagnosis into a PR review of a fix someone, or something, has already drafted.
Incident cost avoidance: what a prevented or shortened incident is worth
Incident cost avoidance is the hardest of the four metrics to pin down, and also the one most likely to move an executive conversation, because it puts a dollar figure on the thing the whole investment is supposed to prevent. The way to make it defensible is to anchor it to incidents that actually occurred. Pull the last 12 months of real incidents, calculate the revenue impact of each one, downtime duration multiplied by revenue per minute or hour, plus remediation labor, and use that distribution as the cost basis instead of a number pulled from an outside benchmark.
A team's own incident history describes the company's actual exposure, so it will carry more weight with its own finance department than an industry figure ever will.
Cost avoidance breaks into two measurable components. The first is incidents prevented entirely, caught and contained by automated detection before they escalate into something a customer notices. The second is incidents that still happen but get resolved faster, shrinking the window of revenue impact. Both are measurable after deployment by comparing the severity distribution of incidents before and after the automation went live. A third component sits alongside these two: automated evidence collection, case documentation, and response tracking cut down audit and remediation costs, and consistent incident handling through automated playbooks supports frameworks including NIST CSF 2.0, NIST SP 800-61r3, ISO 27001, and PCI DSS.
An ROI model built only on upside will get challenged, and it should be. Any model that counts the savings and ignores this exposure isn't complete. The strongest objection to the whole cost-avoidance exercise is that a prevented incident can't be directly observed; there's no ticket for the outage that never happened. The shift in severity distribution serves as the proxy. If the share of high-severity incidents in the post-deployment period drops relative to the pre-deployment period, that drop shows the avoidance occurred, even though no one can point to the specific incident that got stopped before it started.
How the four metrics interact as a system
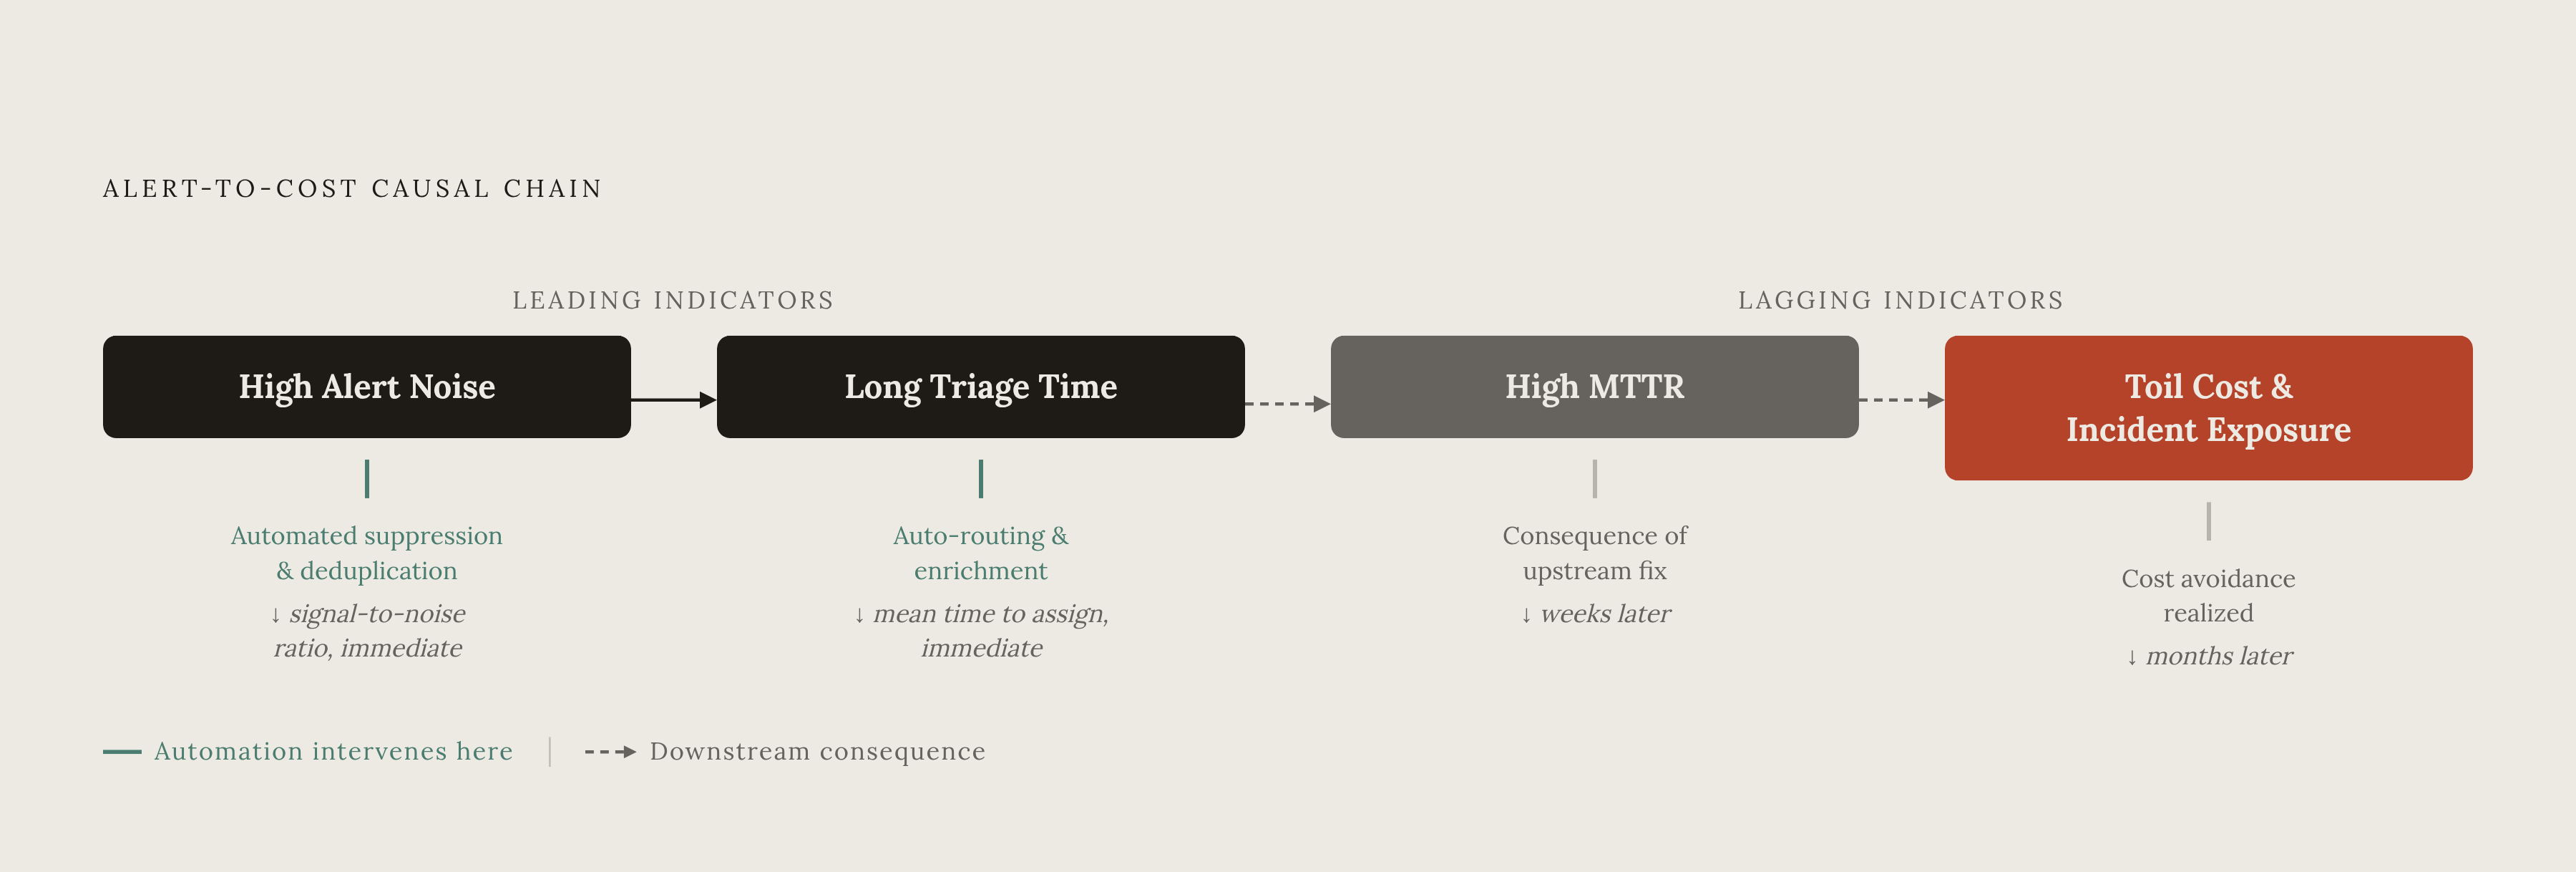
The four metrics form a causal chain, and reading them as a checklist misses what the chain is actually showing. High alert noise drives long triage time, long triage time drives high MTTR, high MTTR drives high toil cost, and high toil cost tracks with high incident cost exposure. Automation breaks this chain at the alert and triage stages first, and the downstream effects in toil cost and cost avoidance appear weeks to months later, so a team needs both leading and lagging indicators in the same report.
There's a specific pattern that signals automation adding complexity without adding payoff: MTTR stays flat or improves only modestly while engineer hours on incident work stay just as high as before.
Agentic AI platforms have started surfacing ROI views that correlate cost, usage, and outcomes directly, letting a team see which automated workflows are earning their keep and where the next investment should go. That turns the four-metric framework into a continuous management practice instead of a one-time justification exercise run before a purchase order gets signed.
One Patch, which verifies every pull request against live production telemetry after deployment, closes a specific gap in that causal chain: incidents that originate from a deployment regression and go undetected until a user reports them inflate both MTTR and toil cost in ways pre-deploy CI testing simply cannot catch. Automated post-deploy verification catches those regressions before they ever enter the incident queue, which keeps them out of the MTTR and toil numbers altogether rather than making them faster to resolve once they've already landed.
The highest-level check on all of this is the analyst time allocation test. The real signal that automation has changed how a team operates is whether the percentage of engineer time spent on proactive work, rather than reactive incident response, is actually shifting toward proactive. If analysts are still spending most of their time on reactive triage after implementation, the four metrics can look like they're improving while the underlying allocation problem hasn't moved.
Building the ROI case: what to measure before deployment, at 30 days, and at 90 days
You build a credible ROI case before deployment starts, and you don't reconstruct it afterward from whatever data happens to be lying around. The baseline collected in the first step is the only thing that makes any post-deployment number legible to finance and to leadership, because without it there's nothing to compare the new number against.
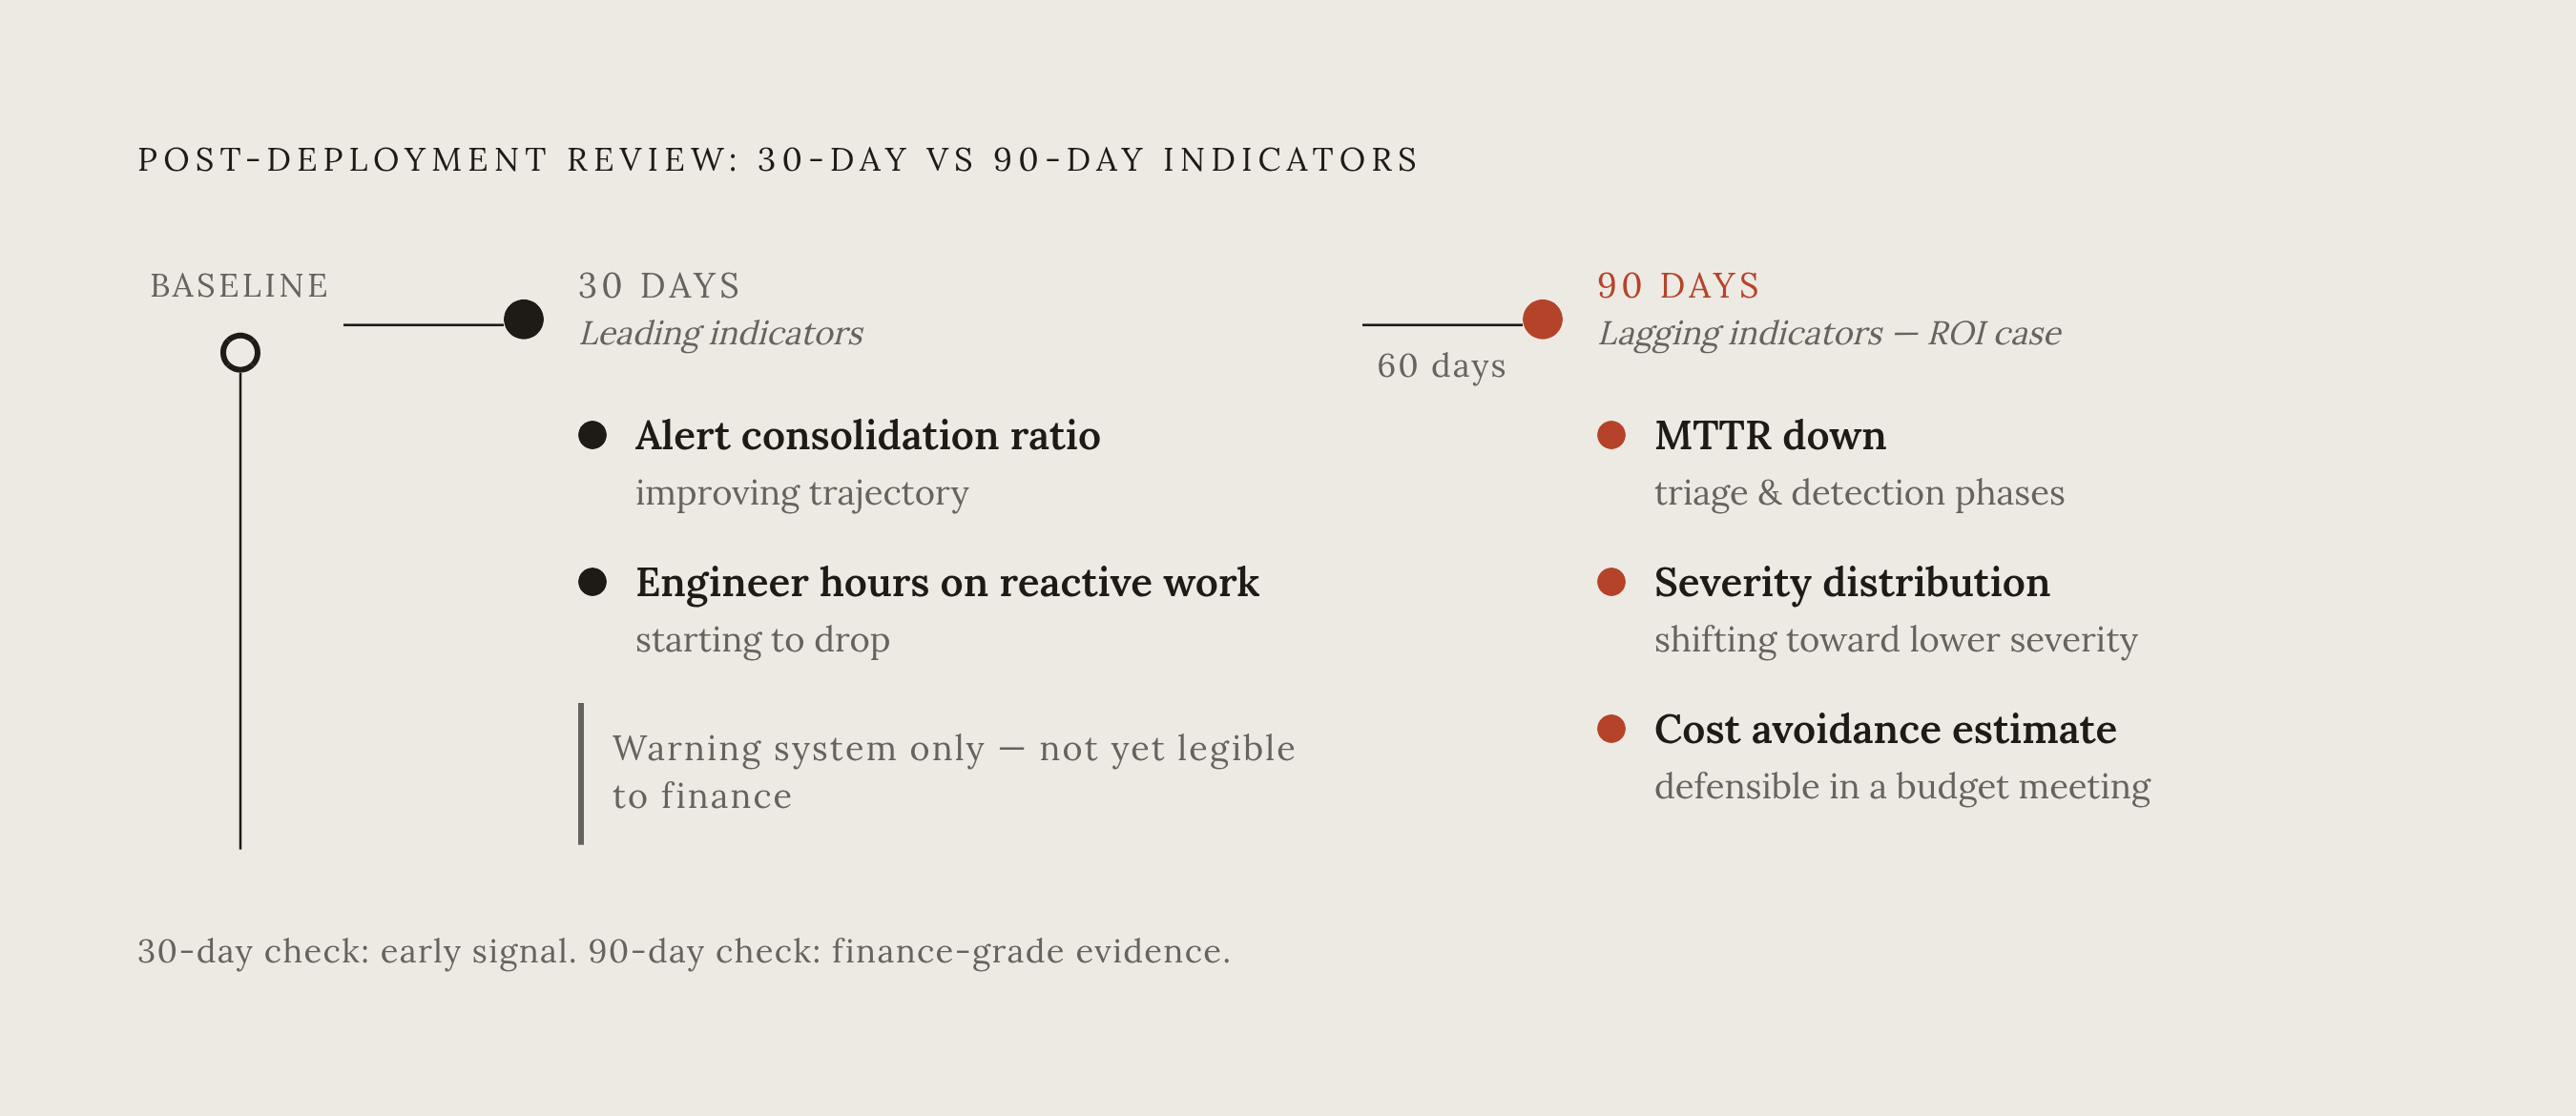
At 30 days, the check is on leading indicators. Is the alert consolidation ratio improving, or does alert hygiene need attention first, before automation can do its job? Are engineer hours on reactive work starting to drop, or has the team simply gained a new tool to supervise without any corresponding reduction in workload?
At 90 days, the lagging indicators confirm or deny what the 30-day numbers suggested. Then apply the pre-deployment revenue-per-incident figure to the severity distribution improvement and the MTTR reduction to produce a cost avoidance estimate that can actually be defended in a budget meeting.
A healthy 90-day picture has the alert consolidation ratio improved, MTTR down specifically in the triage and detection phases, engineer hours on reactive work declining, and the incident severity distribution shifting toward lower severity overall. A warning pattern looks like this instead: MTTR is flat, alert volume is unchanged, and engineers report having a new tool to manage. That combination is complexity without payoff, and it needs remediation before anyone tries to build an ROI case on top of it.
If a security automation program reduces analyst hours, cuts MTTR, and prevents incidents, it delivers financial value that a properly built ROSI model can actually show. The measurement plan outlined here, run before deployment, checked at 30 days, and confirmed at 90, is what makes that model properly built. Teams that keep running this cadence quarter over quarter stop treating it as a one-time justification for a purchase and start using it as an ongoing way to see where automation is earning its cost and where the next dollar of investment should go.