The Deployment Validation Stack That Keeps Regressions Off the On-Call Roster
Automated verification catches regressions before they page on-call teams.
Reducing on-call alert fatigue from bad deployments requires automated verification. A deployment validation stack connects progressive rollout gates, continuous synthetic checks, and deployment-scoped telemetry comparison so that regressions trigger a verification response before they become an on-call page. Each layer tests what the layer before it leaves unproven, from whether it is safe to expose the first users to a change to whether it gives the right business outcomes in production.
Why CI passing is not the same as deployment succeeding
CI passes, staging smoke tests pass, and deployment automation reports success. Shortly afterward, a business-critical checkout flow degrades silently. After a downstream dependency’s schema has changed, the code processes invalid data without throwing an error. The deployment succeeded as an operation while failing as a business change.
One team’s pipeline passed 800 tests before a production deployment caused a critical checkout regression under a real-data distribution that no test environment had replicated. CI verifies code behavior in isolation, while configuration drift, unpinned dependencies, and environment-specific runtime conditions affect the running system. A payment can return 200 yet leave an order pending forever, so a response that looks successful does not prove that the transaction succeeded. CI is necessary, but verification must continue beyond the artifact and into production.
What a deployment validation stack actually is and why it must be layered
A deployment validation stack is a sequence of verification gates. Its layers are progressive rollout gates, synthetic checks, and real-telemetry comparison. They answer different questions at different points in a change’s life. Configuration failures may be visible at once among the few users who see the change, while business-logic degradation is visible only with a particular mix of users and dependency drift may be visible later in the running system.
A rollout gate compares old and new versions under real traffic, but its evidence comes from a limited population and observation window. Continuous synthetic checks keep running scripted business journeys after that window closes, while telemetry comparison checks real requests that those scripts do not cover. Each gives evidence for a different response, which can be a pass/fail decision, a business-metric deviation, or a telemetry diff.
OneUptime’s continuous verification guide says a deployment is complete when responses are correct, integrations work, and business-critical flows finish without errors, all of which must be checked even when pods are running. That distinction changes the definition of deployment success. At the basic end, uptime checks and error-rate alerts expose complete outages. Continuous verification goes further by connecting canary analysis, synthetic journeys, and business metrics to automated rollback when anomalies appear.
Progressive rollout gates: limiting blast radius before most users see the change
Progressive rollout constrains exposure while evidence accumulates. Canary, blue/green, and rolling strategies serve verification when advancement depends on observed behavior. A canary routes a small fraction of real traffic to the new version and compares it with the old version under the same conditions. That comparison uses actual load, which a pre-production test does not have.
The decision must be explicit and enforceable. Automated canary analysis evaluates production behavior during the rollout window against pass criteria tied to SLOs and error budgets. “No obvious crash” is not a sufficient criterion, and a dashboard that someone watches does not make the rollout a gate. Rollback capability must exist from the start so that a failed evaluation can trigger an automated response.
However, this first gate has the narrowest evidence base and the shortest window. Silent degradation can remain within aggregate thresholds, and particular user flows or data distributions may not appear during the canary. Passing therefore establishes permission to widen exposure. The remaining uncertainty belongs to verification that continues after rollout ends.
Synthetic checks: the layer that keeps running after the rollout is complete
Synthetic monitoring keeps running scripted journeys that reflect production from outside the cluster. Its schedule is independent of whether a deployment is underway, so it can detect degradation caused by later dependency drift, configuration drift, or changing data conditions. A check that runs every 60 seconds does not stop collecting evidence when the canary window closes.
The assertion determines what the check can catch. A health check asks whether a service returned 200, while a synthetic checkout asks whether the transaction finished with pricing data that is business-valid. The journey should exercise the full flow, including adding an item to a cart, retrieving pricing with a freshness assertion, and completing the path. The synthetic_monitor.py example illustrates this pattern through a pricing timestamp check and a cleanup path. An order that breaks in an intermediate state can fail that business assertion even when every status-code check passes.
The synthetic-request header pattern marks requests so that services skip charges, emails, and fulfillment while running the real code path. OneUptime’s PDV guide describes health checks, smoke tests, integration tests, and synthetic user flows implemented as ArgoCD PostSync hooks to catch issues within minutes of deployment. Those deployment-time checks provide an early evaluation, while continuous scheduling preserves the synthetic layer after the hooks have finished.
Real-telemetry comparison: what only production evidence can tell you
Synthetic checks show whether the chosen journeys work, but can only cover those journeys. Production telemetry shows the mix of actual requests, including what users do and the data conditions that no script covers. Comparing logs, traces, metrics, and error distributions before and after a specific deployment adds that missing evidence.
The comparison asks a bounded question. Did this deployment change error rates, latency distributions, or business-metric trajectories beyond the accepted range relative to the version it replaced? Elevated latency on a dashboard does not answer that question by itself. A release verification workflow connects the increase to the recent deployment, compares it with prior behavior, surfaces the likely blast radius, and supports a rollback decision.
That evidence depends on instrumentation coverage and consistent context propagation. Without instrumentation, behavior stays out of sight, while broken propagation splits one request into disconnected traces and makes it harder to find the root cause. The Battalion project’s Verifier RFC distinguishes the Deployer, which gets pods running, from the Verifier, which compares observed behavior with explicit expected outcomes and produces durable verification evidence. That boundary makes production evaluation a distinct responsibility. For AI pipelines, it also means checking output quality, because a semantic regression may happen without a crash or an error-rate increase.
How the three layers fit together as a verification sequence, not a monitoring stack
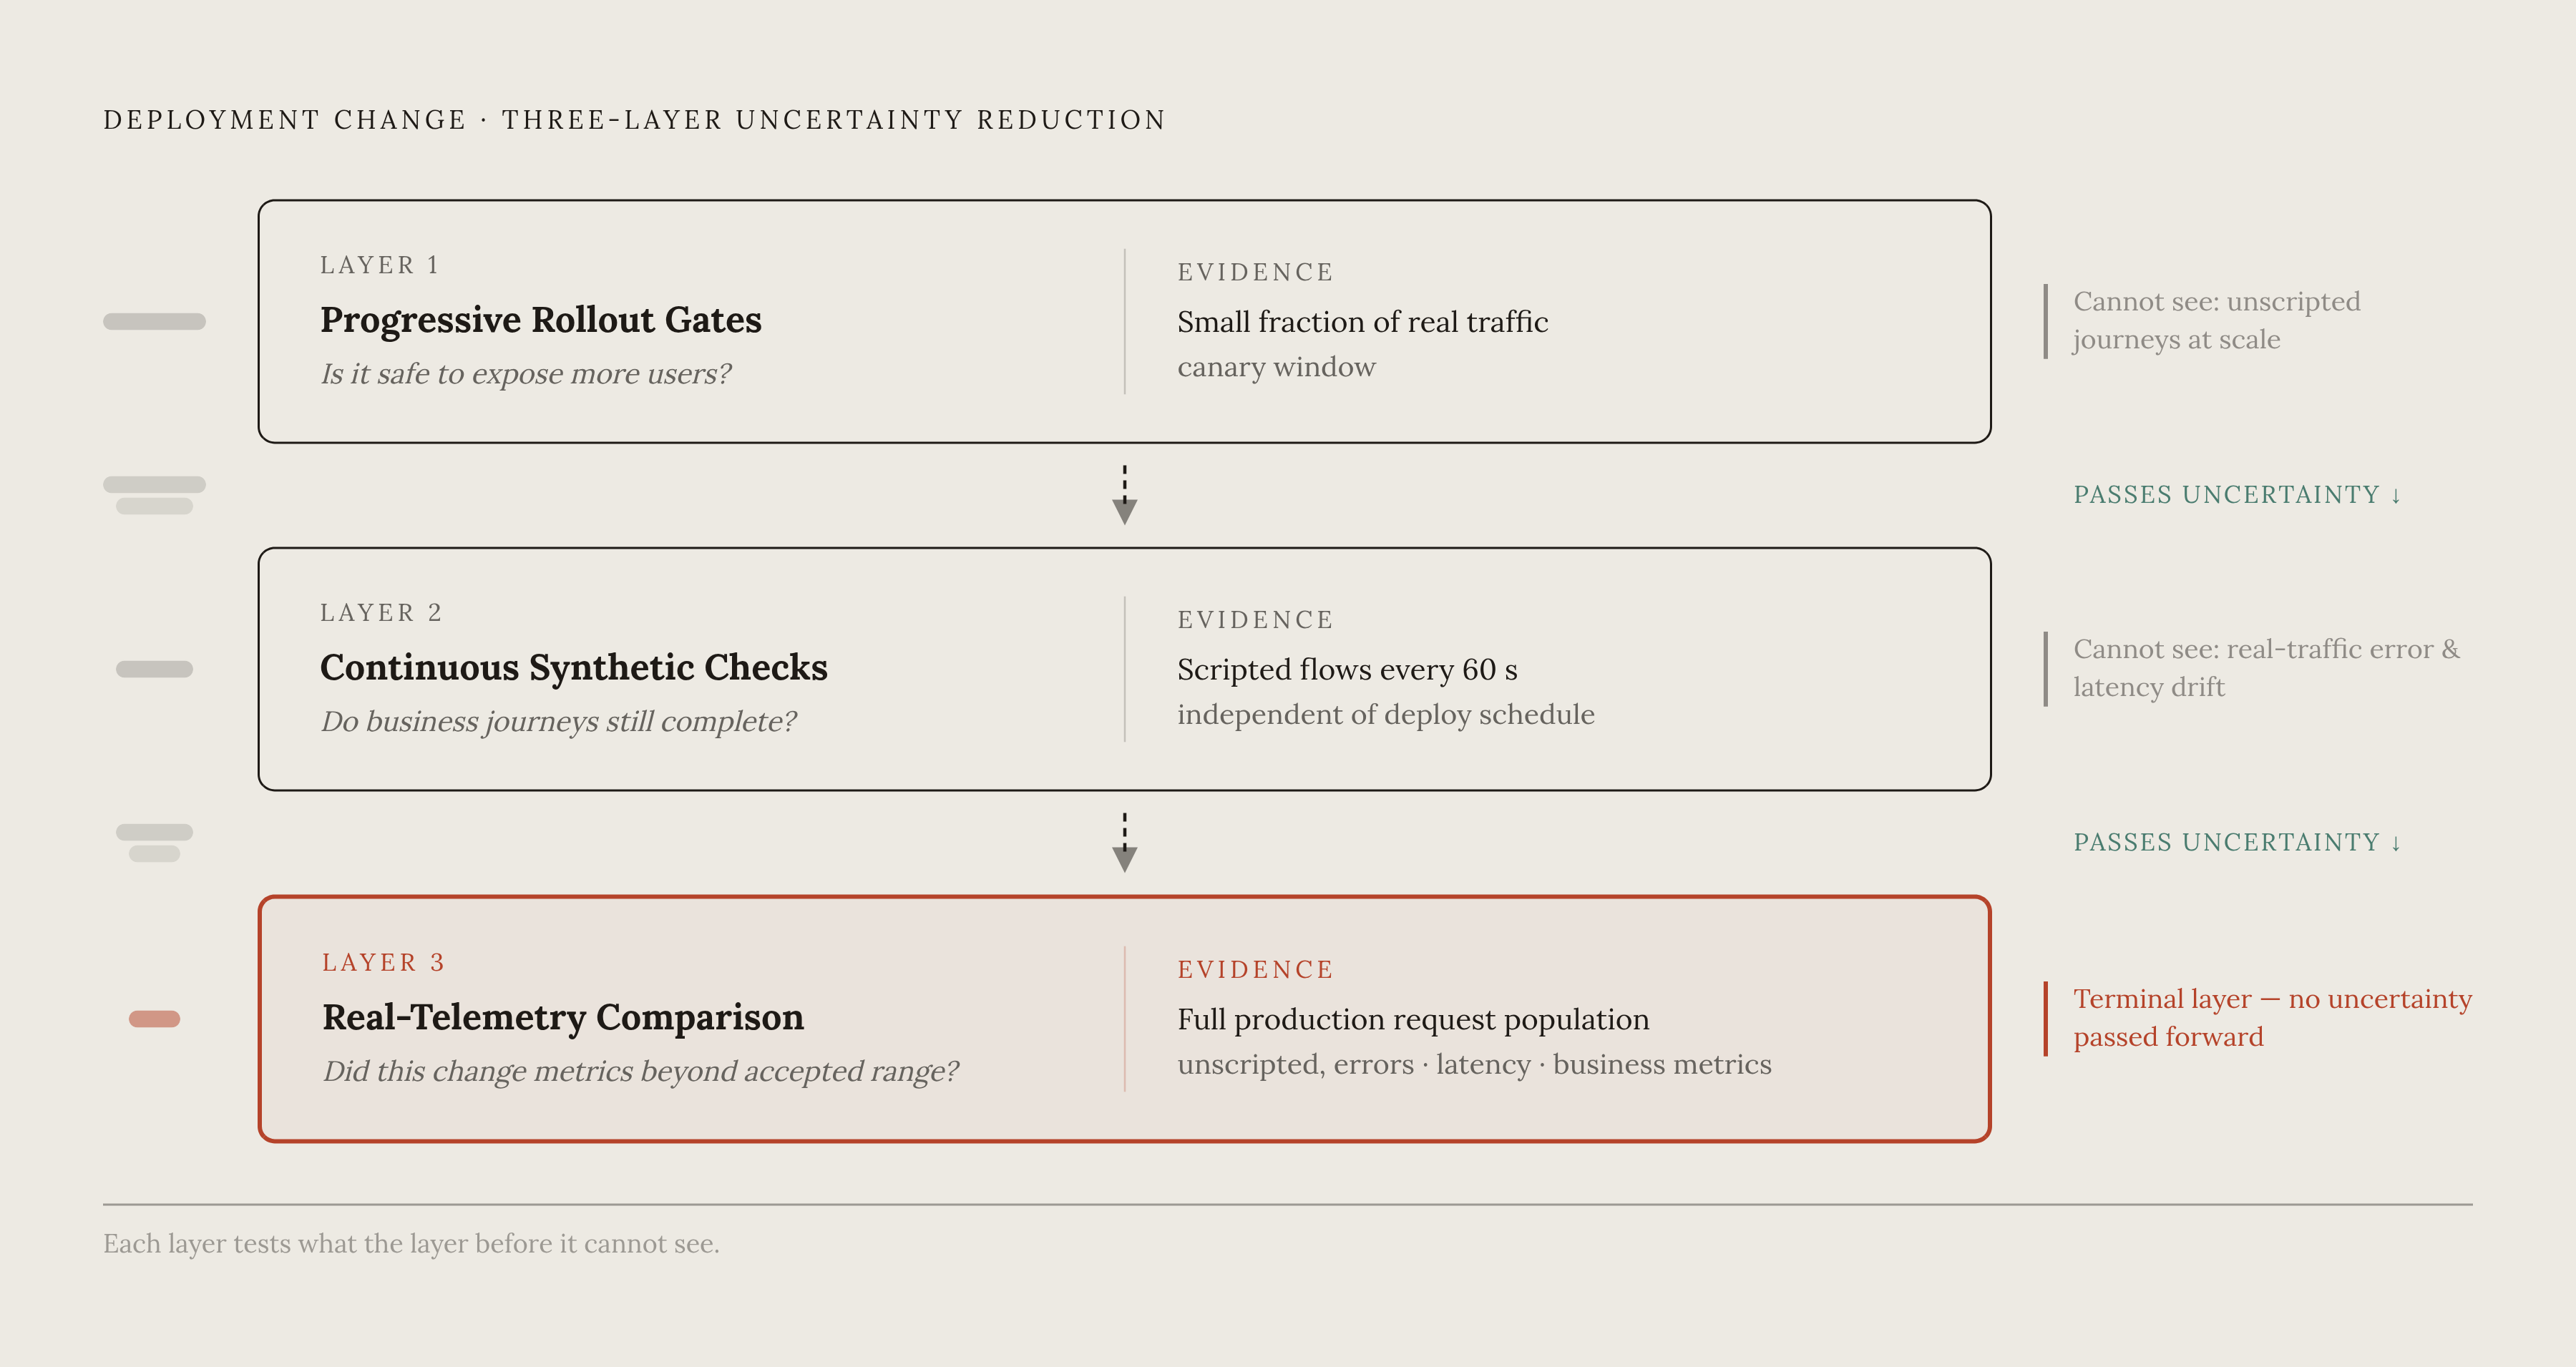
The sequence works by narrowing what remains unproven. The rollout gate establishes whether initial real-traffic behavior permits wider exposure, and continuous synthetic checks test whether business journeys remain correct beyond that decision. Telemetry comparison then examines the unscripted request population and connects degradation to a release.
A team with sophisticated telemetry comparison but no progressive rollout may expose all users to a regression that a canary would have caught in the first five percent of traffic. Even after a canary passes, a later dependency change can still break checkout. The sequence is logical rather than a requirement that continuous checks stop while another layer runs.
This architecture also changes how escaped regressions are interpreted. A failure that passes all three layers points to a gap in assertions, instrumentation, or thresholds that needs examination, rather than establishing that production incidents are inevitable. These capabilities must therefore form a verification sequence with explicit pass criteria and automated responses at each gate.
How do teams catch production regressions right after deploy, and where does tooling fall short?
Rollout tooling must turn evidence into automated pass/fail decisions. Visibility alone is insufficient. Harness’s Verify step analyzes logs and metrics after deployment and can trigger rollback when it finds anomalies, making verification actionable. At the rollout layer, the required capability is a decision that can stop or reverse progression.
Synthetic tooling has a different operational requirement. It must run independently of deployment events, assert on business outcomes, and emit metrics into the same alerting layer as production telemetry. ArgoCD PostSync hooks can support deployment-time validation, but a hook alone does not provide the continuing schedule. A synthetic check that only tests whether an endpoint returns 200 leaves silent business failures outside its assertions.
Telemetry tooling must detect deployment events and compare how the system behaved before and after the deployment. It also needs to connect the code diff with logs, traces, metrics, and error distributions. General observability without deployment-scoped comparison leaves the central investigation manual. Teams can see latency rising but still have to determine which change caused it.
These gaps are often gaps in action or correlation. Tool sprawl compounds them because switching among deployment, observability, tracing, and synthetic systems adds to MTTR during an active regression. The practical requirement is a workflow that joins the evidence to the release and the response, without making the engineer reconstruct that relationship under pressure.
Why agentic and AI-assisted development makes this stack non-negotiable
AI-assisted development increases the rate of production changes without proportionally increasing visibility into their runtime behavior. Checking each deployment by hand cannot keep up with that volume. Silent logic failures and unsafe behavioral changes also weaken the usefulness of crash-based signals. Output that looks right can be processed in the wrong way without setting off a standard error-rate alert.
An agent can act on its environment, allowing a behavioral regression to propagate through downstream systems before any single service emits an error. Semantic evaluation must therefore test correctness. OpenTelemetry’s GenAI semantic conventions are still in Development status as of v1.41. Attribute names can change.
For teams operating these workloads, the corresponding safeguards include treating prompts and configurations as code, placing guardrails at input, output, and action levels, and using immutable logging to trace decisions to specific AI-stack versions. These controls supply the versioned evidence that verification needs. They do not replace the three layers, but apply their requirements to behavior that conventional error monitoring may miss. Automated verification becomes a precondition for moving fast safely.
Building the stack incrementally: where to start and what order makes sense
Teams should start with the regression class currently reaching on-call. Teams do not need to implement all three layers simultaneously, even though the completed workflow needs all three. If incidents are dominated by startup errors, crashes, or immediate error spikes, the first investment should be progressive rollout with automated pass/fail criteria tied to existing SLOs. Rollback capability is its prerequisite. Without that response path, the first gate still depends on someone intervening.
If deploy-time failures are already gated but silent degradation reaches users, the next investment should be continuous synthetic checks. Teams should identify the two or three most important business-critical flows and write assertions for completed outcomes. Those flows need instrumentation that exposes business validity. Running them continuously also covers dependency changes that arrive without a deployment by the team.
If synthetic checks already run but investigation still centers on finding the responsible release, deployment-scoped telemetry comparison is the next gap to close. Teams should instrument services for deployment-correlated telemetry and adopt tooling that automatically connects deployment events with changes in error or latency distributions. Context propagation must work consistently as requests pass from one service to another. A deployment checklist, versioned test environments, and explicit rollback plans provide the operational foundation for reliable responses across the stack.
The completed system moves verification work out of the on-call investigation. Progress is measured by whether deployment failures are detected, evaluated, and acted on without requiring an engineer to assemble the case manually.